By: Live Oak Private Wealth
Introduction
“Until one is committed, there is hesitancy, the chance to draw back, always ineffectiveness. Concerning all acts of initiative and creation, there is one elementary truth the ignorance of which kills countless ideas and splendid plans: that the moment one definitely commits oneself, then providence moves too.
All sorts of things occur to help one that would never otherwise have occurred. A whole stream of events issues from the decision, raising in one’s favor all manner of unforeseen incidents, meetings, and material assistance which no man could have dreamed would have come his way.
Whatever you can do or dream you can do, begin it. Boldness has genius, power, and magic in it. Begin it now.”
– William H. Murray
American Educator, Lawyer, and Politician
So it began.
September 1, 2018. We started a new wealth management firm. There are many ways of going through life without taking that risk, and plenty of them are just as rewarding – more or less so. Our passion today, as it was in September of 2018, is to serve clients in a better way. Our team is pleased with our progress in three short years and grateful to you for allowing us to do something that is so important to us all, and which we enjoy doing. We find ourselves just as excited today as we were leading up to fall of 2018, meeting weekly, planning in clandestine fashion, in a discreet conference room at the Wilmington Airport. We remain passionate about our unique value proposition on wealth management. We thank you, our clients, for allowing us to dream big.
This quarter marks the three-year anniversary of Live Oak Private Wealth. Live Oak Private Wealth was born out of a collective team of six with over 100 years of experience. Our vision was, and continues to be, that there had to be a better way to deliver comprehensive wealth management to wealthy individuals and families. We never contemplated the possibility of an accretive merger eighteen months in (during the throes of a pandemic), but we are now a very strong team of twelve professionals.
This quarter also marks the 20th anniversary of the terrorist attacks on September 11, 2001. It is hard to believe that it has been 20 years, when it feels like yesterday to us. Surprisingly we both started our investment careers as rookie stockbrokers with Dean Witter Reynolds in New York – Frank in 1982 and Bill in 1986. We spent every day of the workweek while training in New York taking the subway into the station under the World Trade Centers and riding the elevator either to the 8th floor of #5 World Trade or to the 52nd floor of the South Tower. We were both so proud to have made it to Wall Street. Dean Witter Reynolds occupied the majority of the South Tower at that time. It remains especially painful to us as we recall the Towers on fire and collapsing in 2001. The Financial District of New York’s lower Manhattan was known for its soaring monoliths that housed the famous financial firms and the Word Trade Centers were the epitome of what finance and Wall Street represented. The terrorist attack showed the financial system’s vulnerability to physical destruction and in the years that followed, many financial firms, brokers, and exchanges unfortunately moved out of Lower Manhattan. Now when we travel to New York for meetings or conferences, we always try to make time to take in a quick trip downtown to the Memorial where the Twin Towers stood, just for reflection. We will be there in December, again for reflection and to never forget.
Market Statistics as of September 30th, 2021
| Index | 2021 3rd Qtr | 2021 YTD 9 Months |
|---|---|---|
| DJIA | -1.46% | 12.12% |
| S&P 500 | 0.58% | 15.92% |
| S&P 500 (equal weight) | -0.22% | 18.92% |
| S&P Mid Cap | -1.76% | 15.52% |
| Russell 1000/Growth | 1.16% | 14.30% |
| Russell 1000/Value | -0.78% | 16.14% |
| Russell 2000 | -4.36% | 12.41% |
| NASDAQ Comp. | -0.23% | 12.66% |
After five consecutive quarters of gains, stocks turned in a mixed performance for the quarter ending 9/30/2021. The barrage of negative news in September finally slowed what had been an extremely resilient market. Supply chain disruptions, soaring energy prices, COVID-19, stalled infrastructure bills, inflation fears, and a Fed taper finally weighed on the markets. In September, the S&P 500 fell by 4.7% (total return), after seven consecutive months of gains. For the quarter, the S&P 500 index returned 0.58% on a total return basis, while the Dow Jones Industrial Average (-1.46%) the Nasdaq Composite (-0.23%) the S&P Mid-Cap 400 (-1.76) and Russell 2000 Index (-4.36%) all had negative quarterly returns. Essentially it was a quarter where the average stock fared much worse than the S&P 500 index, which as you know is heavily skewed by just a few mega-cap growth names. For the quarter, the Russell 1000 Growth Index managed a 1.16% gain, versus a decline of .78% for the Russell 1000 Value Index. For the nine months ending 9/30/2021, the Russell 1000 Value benchmark, remains ahead of the Russell 1000 Growth benchmark by just over 1.8%. During the quarter ended 9/30/2021, the leading sectors were communication services (+1.4%), information technology (+1.1%) and utilities (+0.9%). Market laggards were industrials (-4.5%), materials (-3.9%) and energy (-2.8%). As we enter the fourth quarter, investors continue to grapple with a number of headwinds. Rising inflationary pressures, supply chain bottlenecks, COVID-19 variants, and a more hawkish Fed are all problematic in the short-term.
Portfolio Strategy Discussion
Growth Strategy
Commentary & Thoughts
It is almost impossible today to turn on a TV or pick up a newspaper without hearing something about inflation. Many of the Federal Reserve spokespersons say the inflation we are experiencing is “transitory.” That word might go down as Word of the Year in 2021. There is an enormous asymmetry of outcomes riding on the theoretical view that this inflation is temporary. If the Fed turns out to be wrong, and inflation is actually persistent and lasting, it would most likely have significant consequences for a growth stock-dominated equity market and whoever continues to plough trillions of dollars into negative-yielding bonds. The current premise that interest rates will remain low forever might be akin to playing with fire, as inflation can affect interest rates which can pose serious risks to equity portfolios.
Maybe the Fed is right in their opinion regarding the temporary nature of this bout of inflation. But during early July of this year, FactSet reported that a record 197 S&P 500 companies cited the term “inflation” in their first quarter earnings calls. The prior record was 163 companies.I
We are also hearing, reading, and witnessing supply chain disruptions. Almost anything we wear, eat, touch, buy, or sell has been shipped to a store of some kind where we purchased it. Much of this originated on a ship and then was delivered by truck. Shipping costs are not immaterial, and costs are up. The Freightos Baltic Index of global container freight shipping rates is up 381% since August 2019.II A very large proportion of what we buy from Amazon arrives in a container. This aspect of the inflation discussion should prove to be temporary, we hope.
Money supply growth is another story. Excessive money supply has created substantial issues regarding inflation historically. Issuing more currency than economic growth warrants debases (reduces) people’s purchasing power. The U.S. money supply (M2) expanded by 32% between January 2020 and May 2021, from $15.4 trillion to $20.4 trillion, according to the Federal Reserve Bank of St. Louis. Now it appears that in the economy there is one-third more money volume even though the economy is only fractionally larger. This money supply growth has gone hand in hand with the massive increase in U.S. government debt. Our federal debt is now 127% of GDP, according to the St. Louis Federal Reserve Bank. The prior all-time high was 119%, in 1946 after the end of World War II.III
As growth stock investors, we face risks as central banks either allow for interest rates to increase to a normal level or raise rates themselves to forestall inflation. The risks to fixed income continue to be extreme as we remain in a “bond bubble” due to bond’s expensive prices relative to ultra low rates. Interest rates are a powerful determining factor in asset prices, especially higher valuation equities. The current P/E ratio on the S&P 500 is 21-24 depending on the data source. Therefore, the S&P 500 earnings yield (the inverse of the P/E ratio) is approximately 4.50 %. Compared to a 1.50% 10-year Treasury, stocks are not that aggressively valued. But if the 10-year Treasury yield creeps up in tandem with inflation, the P/E ratio on equities should shrink. Another quarter and the markets continue to climb up another rung higher on the wall of worry, yet global stocks continue to enjoy one of their best years in recent memory. We continue to be amazed at the amount of speculation in the height of market euphoria. The speculative chase for return is bordering on the absurd. Junk bond yields have fallen below the (annualized) inflation rate – a first. Companies like Zymergen are going public at $30.00 and trading up to $48.00 with…zero revenues, but 10 times 2023 revenue estimates…bleeding cash. Clip art of a rock just sold for $1.3 million. This is .jpeg file of a cartoon rock. Complete lunacy.
Third Quarter Portfolio Activity
Portfolio trading activity during the quarter with our Growth Strategy was again inactive and we made no changes to our model portfolio. We did participate in July in MOI Global’s Wide Moat Summit Conference, where we listened to presentations from investees Lockheed Martin, Ferguson, and Disney. Our thoughts and framework and confidence remain unchanged with these three positions. We also sat in for Investor Analyst Days with Danaher and Brookfield Asset Management where we also remain comfortable with our investments. The rest of the model portfolio positions were each reappraised using the most recently reported quarterly earnings data. We remain comfortable with all, notwithstanding their expensive prices.
Where we are uncomfortable is additional concerns that were recently highlighted in a Wall Street Journal article by Dawn Lin.IV We have touched on this risk in many past letters, yet the risks are still prevalent, and growing. The article discusses the ever-growing presence of algorithmic investment models. The models are set forth by the BlackRock’s of the world and now are controlling $5.0 trillion in U.S. fund assets. This is up from $3 trillion a year ago.
Many investment firms on Wall Street offer advice regarding how to allocate your investment portfolio across asset classes. Many advisory firms across the country rely on pre-set models from firms like BlackRock and Renaissance to construct portfolios for their clients. These quantitative models are different from more traditional models most mutual funds utilize, in that they are linked to computer trading-linked algorithms and $5.0 trillion linked to them is a lot of money flowing through a machine. Many investors today own many of the same securities in these models due to indexation, and of course the majority of investors today own a lot more stocks than usual. It could get really messy on the downside if and when the models were to put through a change in allocation to stocks. Say the 10-year Treasury starts to move up in response to faster tapering by the Fed due to inflation expectations. In this scenario, the model might send an order to the computers to lessen exposure to stocks, and the markets could experience a massive wave of selling in order to stay in line with the models. This has happened before on multiple occasions.
Where we differ from many advisory firms is that we don’t utilize quantitative models. We construct and manage individually tailored portfolios based on company fundamentals and business values related to their price. We will eagerly buy more shares in a good business from a machine that is selling stocks indiscriminately because of macro inputs such as GDP, Treasury yields, or oil prices.
Contributors and Detractors for Growth Strategy
Our thoughts on positions that had the most positive impact on the strategy for the period ending 9/30/2021
AON PLC (AON) +25.2%
Aon was in the process of finalizing their merger with Willis Tower Watson when the Justice Department called it off due to antitrust concerns. We have few if any concerns as Aon has pivoted to large share repurchases instead and the company continues to enjoy solid profits from a hardening insurance pricing environment.
HCA Healthcare (HCA) +21.0
HCA experienced a strong rebound in demand for hospital and healthcare services as the effects of the pandemic moderated this quarter. With a diversified mix of hospitals, urgent care centers, physician clinics, HCA continues to enjoy a strong market presence in the U.S., and as the economy normalized further, we should expect continued growth.
Danaher Corp. (DHR) +19.2
Danaher reported outstanding results in their recent quarter showing 36% revenue growth and 46% cash flow growth. Broad-based strength across the DHR portfolio of life sciences, diagnostics, and environmental & applied solutions helped the company deliver solid growth and should lead to long-term outperformance.
Alphabet Inc. (GOOG) +12.8%
Google delivered another very strong quarter of earnings. Management credibility is on the rise as growth in the core search business has reaccelerated, complementing rapid growth for YouTube and Google Cloud. Margins increased as well. We remain steadfast investors in Google notwithstanding its premium valuation.
CarMax (KMX) +10.6%
As the continued shift in used car sales move more online, CarMax is seizing the opportunity. The used car business is very fragmented and KMX is the largest player with just 4% market share. CarMax combines it national store footprint with its online tools and inventory intelligence to continue to deliver growth for shareholders, through attractive pricing and purchasing experience.
Our thoughts on portfolio positions that had negative or the least positive impact on the strategy for the period ending 9/30/2021
FedEx Corp. (FDX) -24.2%
FedEx is grappling with significant headwinds as severe labor market constraints are pushing up wages and creating costly network inefficiencies. Global trade continues to be impacted by Coronavirus-related disruptions. We remain constructive longer term as foreseeable e-commerce trends remain intact. FedEx’s immense air and delivery fleet and global operations are difficult to replicate, therefore FedEx should weather this storm. Fortunately, we sold some last quarter.
Dollar Tree Stores (DLTR) -15.3%
Dollar Tree too is suffering from supply chain challenges as higher ocean freight costs are pressuring margins. Dollar Tree unfortunately is one of the most import-dependent chains. The expanded Dollar Tree Plus format (items >$1.00) should help and Family Dollar’s expansion into more grocery items should cushion some of these temporary inflation issues. We have nibbled at a few more share on the weakness.
United Parcel Service (UPS) -10.5%
UPS, like FedEx, is vulnerable to global trade. Pandemic-related shipping disruption is causing temporary problems. Again, like FedEx, we are comforted by healthy medium-term growth tailwinds rooted in highly favorable e-commerce trends. The network of brown trucks is a force to be reckoned with.
Air Products & Chemicals (APD) -10.1%
Air Products continues to see slightly depressed levels of demand for industrial gases. Industrial gases typically account for a small fraction of a customer’s costs but are vital to uninterrupted production of so many products. Air Products should continue to enjoy predictable growing cash flow streams and solid returns from long-term contracts and high switching costs with their customers.
Bristol Myers Squibb (BMY) – 9.5%
Bristol Myers growth prospects remain solid as drugs such as Opdivo for cancer and Eliquis for cardiovascular (A-fib) treatment hold potential for better efficacy and treatment. Many remain cautious regarding Celgene, which was a very large acquisition for Bristol and worry about the significant debt attached to the deal. We are comfortable with Bristol and Celgene and its ability to grow earnings and service the debt.
Our thoughts about cash as an asset in your portfolio.
It is difficult to consider cash as an asset today and even harder to hold much of it. It yields 0%, but it is an important asset to us. We don’t “raise cash” or “decrease cash” based on some view of the market. Cash percentages in your portfolio are not targeted and when more opportunities to buy are present, we buy, and cash levels decrease. Conversely, when there are more companies to sell or trim back than buy, cash levels rise. We don’t worry about the 0% return on cash. The availability of the cash to us is what is important and when opportunities present themselves (like the March 2020 pandemic influenced broad market selloff), we can invest decisively, at favorable prices, because we have the liquidity to do so.
Classic Value Strategy
Commentary & Thoughts
“The market, like the Lord, helps those who help themselves. But, unlike the Lord, the market does not forgive those who know not what they do. For the investor, a too-high purchase price for the stock of an excellent company can undo the effects of a subsequent decade of favorable business developments.”
– Warren Buffett, 1982
As a disciplined value investor, much of our focus revolves around valuations for the companies we own. Currently, the S&P 500 index trades at approximately 20.3 times forward earnings versus 16.8 for the past 25 years. As the chart below shows, other key valuation measures are stretched as well. Much of this can be explained by the “zero interest rate policy” that the Fed has had in place essentially since the financial crisis in 2008. T. I. N. A. (There Is No Alternative) has been in play with investors and savers searching for places to earn some return on their savings. While we understand higher valuations in periods of lower interest rates, we want to emphasize that when one overpays for an investment, your long term investment result will likely be poor.
S&P 500 Index
| Valuation Metric | Latest | 25-Year Average |
|---|---|---|
| Price/Earnings Ratio | 20.3 | 16.8 |
| Dividend Yield | 1.4y% | 2.01% |
| Price/Book | 4.09 | 3.07 |
| Price/Free Cash Flow | 15.28 | 11.05 |
We believe that the assumption that one can buy stocks without any regard for the price can be dangerous to one’s financial health. The thought that a company’s growth in the future is predictable and the price you pay is irrelevant happened in the 2000 bubble and to some extent is happening with a number of “growth” stocks today. GMO’s Ben Inker recently published a research piece titled “Dispelling Myths in the Value Vs. Growth Debate”. In that report, they examine and compare today’s environment with 2000 (see chart on next page) while looking at companies trading at over 10x sales.
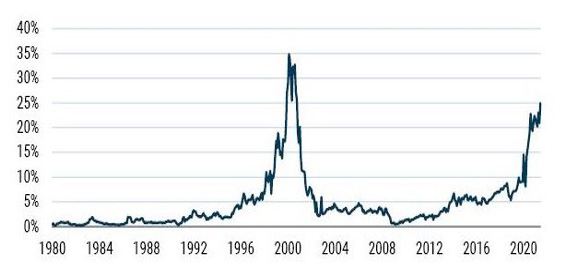 Data from 01/1980 – 06/2021 • Source: GMO, Compustat
GMO points out in the study “…it is not impossible for a stock trading at 10x sales or more to give a good return…the odds are strongly against companies trading at over 10x sales.” GMO compiled data concluding that “the 10x sales cohort has underperformed the market by over 4% a year since 1980, reducing a 30x real gain over the 40 years in the S&P 500 to less than 4x, almost precisely in line with the Bloomberg Barclays U. S. Aggregate Bond index”. Today 25% of the U.S. market is trading at a 10x sales multiple, the highest level ever with the exception of the internet bubble in 2000. Index funds which are market-cap weighted are not immune from the “overpayment” risk, in fact by its very structure the index fund will typically need to increase the weighting of a company as it becomes more and more overvalued.
Investing with a “margin of safety” and utilizing a “value” discipline steers us away from the areas of the market that we believe are currently excessively priced. It is our belief that the case for value is extremely compelling, much like it was back in 2000. We believe that our “value” strategy which focuses on “risk” versus “return” will serve our clients well over the next several years.
Third Quarter Portfolio Activity
During the third quarter we trimmed positions in Pfizer and Alphabet as both stocks spiked higher. In both cases the positions in some client accounts became outsized and our desire was to move the position sizes back to our desired weighting. We remain constructive on each company, but felt on a short-term basis, the shares had met our price objective. We also exited shares of Organon & Company, which we had received as a spin-off from Merck. The Organon position size was not meaningful, and we felt that we should add to the position or exit. We also added a new portfolio holding in shares of Zimmer Biomet (ZBH). Zimmer designs and markets orthopedic products and sells into 100 countries worldwide. The COVID-19 variant acceleration this year resulted in share weakness as many of these elective procedures were deferred by hospitals and/or patients. At the time of purchase, ZBH shares were down approximately 19% from the recent highs and trade at approximately 18 times 2022 estimates. We view Zimmer as a high quality holding that should benefit as the economy reopens.
Contributors and Detractors for Classic Value
Our thoughts on positions that had the most positive impact on the strategy for the period ending 9/30/2021
Sony (SONY) +12.6%
Sony raised its earnings outlook after reporting earnings in early August. Profit growth was driven by strength in demand for PlayStation 5 consoles. Sony also has dominant positions in the film industry, music, and sensors. We feel Sony is well positioned in each of its markets and the shares offer excellent term growth potential.
Mosaic (MOS) +12.4%
Mosaic posted strong second quarter results as strong pricing offset lower volumes. Agricultural markets are strong, driving fertilizer demand. Mosaic shares are currently trading at less than 10 times estimated 2021 earnings. In August MOS announced a $1 billion share buyback. We believe that despite the recent strength that shares remain attractive to long-term investors.
Alphabet INC. (GOOGL) +9.2%
Alphabet earnings, which were released in July, were well ahead of expectations. Revenues surged by 62% and earnings grew by 166%. Despite the recent strength we remain constructive given the dominant position in search and accelerating growth in Google cloud and YouTube. Alphabet’s balance sheet is a powerhouse with approximately $136 billion in cash versus $28 billion in long-term debt.
Pfizer (PFE) +8.7%
Pfizer shares performed well in the quarter largely due to surging demand for COVID-19 vaccines and the potential for many individuals opting for a third booster shot. Second quarter revenues and earnings beat analyst expectations. While we are hesitant to extrapolate out what the vaccines mean for revenues and earnings going forward, we continue to like the shares trading at less than 14 times earnings and a dividend yield of 3.6%.
JP Morgan (JPM) +4.2%
JP Morgan has been a core holding dating back to 2012. JP Morgan’s most recent quarter beat expectations largely due to a release of loan loss reserves. JPM should benefit from economic growth as the economy reopens and any increase in interest rates should help lift net interest income. JPM continues to return capital to shareholder through a $30 billion buyback and 2.4% dividend yield. We view JPM as a high-quality core holding.
Our thoughts on portfolio positions that had negative or the least positive impact on the strategy for the period ending 9/30/2021
Terminix (TMX) -15.2%
Terminix shares were weak despite reporting a quarter with strong revenue and earnings growth. Shares reacted negatively after the earnings due to fears over the tight labor market and slightly higher than expected termite claims. We remain favorable with regards to TMX shares as the company has transitioned to a “pure-play” pest control company over the past year. Leverage is currently below the company’s target, leaving room for acquisitions and share repurchases.
UPS (UPS) -13.4%
UPS share price declined in the past quarter despite reporting solid second quarter results. Keep in mind UPS shares were up a whopping 24% in the second quarter, so the recent pullback was not surprising in our view. UPS remains well positioned long term and the shares offer a 2.2% dividend yield as well.
Bayer AG ADR (BAYRY) -11.7%
Bayer shares have remained under pressure largely due to lawsuits related to Roundup, which it acquired as part of the $63 billion Monsanto acquisition back in 2018. Bayer has maintained that Roundup does not cause cancer and anticipates that the Supreme Court will decide whether to hear the case in the next few months. Bayer maintains a strong competitive position in both the healthcare and crop science business.
Twitter (TWTR) -11.3%
Twitter shares were weak in the most recent quarter despite better-than-expected performance across all of its major products and geographies. TWTR recently launched its first subscription service, Twitter Blue, which could help monetize its platform. We continue to view Twitter as a unique internet asset with improving monetization. TWTR’s balance sheet is strong with over $8 billion in cash versus $4.5 billion in long-term debt.
Novartis (NVS) -10.8%
Novartis shares were weak despite a better-than-expected quarter where revenues increased 14% and earnings per ADR increased by 57%. Heart failure drug Entresto saw a 53% gain and psoriasis drug Cosentyx rose 24%. Share weakness could possibly be attributed to concerns over potential drug price regulation with the Biden administration. Novartis shares yield approximately 4%, so an investor gets paid to wait for this high-quality] pharma company.
International Strategy
Commentary & Thoughts
Investing is never boring, and the investing business overseas is sometimes a full-contact sport.
China was the main story with our International Strategy this quarter. Many investors, including us, are now voting with our feet as we contemplate the widening series of regulatory crackdowns coming from the Chinese government. We obviously underestimated the power of Beijing and their decision to curtail the operations of China’s for profit tutoring industry. Our investment in New Oriental Education was dramatically affected by being forced to now operate as a non-profit. Never before have we been wiped out by the heavy hand of a government. Last quarter as many Chinese stocks were trending down, including New Oriental, we attempted to recalibrate our potential downside scenarios and reassess the probability of a permanent loss. We felt the probability was quite low the Chinese authorities would wipe one of the most important sectors in their economy, preparing young students for college prep exams. Obviously, we were dead wrong by not having the probability high enough.
We as long-term global investors in great businesses are drawn to China because of its huge population, still growing economy, and booming tech industry. Yet now we understand more clearly the difficulty of anticipating Chinese President Xi Jinping’s decisions and the risks. We have had to reassess the risks and rewards endemic to investing in this authoritarian state. We have completely inverted our approach and framework related to our entire China exposure in light of these new developments. We elected to take down our exposure in our other Chinese positions (Alibaba, Tencent, Baidu.com, and JD.com) by half and now have even a smaller exposure to China.
Other portfolio activity during the quarter saw us buying more GAN Limited, making it a full portfolio position as well as adding Unilever in some accounts. GAN provides software solutions for the rapidly growing online sports betting industry and online casino gaming. The U.S. casino industry is transforming to digital and online following the repeal of a federal ban on sports] betting in May 2018. Unilever, in our opinion, is one of the world’s best branded companies. 400 different brands being sold in over 190 countries, Dove soap, Hellman’s mayo, Vaseline, Lipton Tea, and Ben & Jerry’s ice cream continue to grow and satisfy many consumers worldwide. A small dip in the price of this global blue chip this quarter prompted us to add shares.
Contributors and Detractors for International Strategy
Our thoughts on positions that had the most positive impact on the strategy for the period ending 9/30/2021
ICON PLC (ICLR) +21.4%
Dublin, Ireland-based ICON is a global provider of consulting, outsourced development, and commercialization services to the pharmaceutical and biotech industry. Known as a “CRO”, or contract research organization, ICON benefited this quarter from robust new business conducting complex trials with thousands of patients in varied drug developments. ICON also benefited this quarter from cost saving synergies from its recently completed merger with PRA Health Services.
GVC Holdings (GMVHY) +17.8%
GVC Holdings, also known as Entain, is an online sports betting and gaming company. GVC had a big quarter on the back of a $22.4 billion takeover offer from DraftKings. The U.S. market opportunity for sports betting is rapidly growing and it is possible that two thirds of the U.S. will allow legalized sports wagering in a few years. DraftKings is attempting to consolidate GVC to capture more of that market. We will watch patiently as this takeover dance plays out.
Daikin Industries (DKILY) +16.4
Daikin Industries is a Japanese multinational air conditioning manufacturing company. Daikin is the global leader in air conditioning and a major player in air filtration. Air filtration is what attracted us to Daikin and the company’s American Air Filter Company continues to benefit from increased demand for clean air due to the Pandemic. Increased residential construction is driving further demand for the company’s products. We remain comfortable with our Daikin investment.
Vivendi SA (VIVHY) +5.8%
Vivendi is a French media conglomerate with businesses in television, film, video game, book publishing, and music. Music is our thesis for owning Vivendi, as the company is spinning off its ownership in Universal Music Group at almost a $40 billion value. On a sum of the parts basis, Vivendi remains attractive, and we eagerly await Universal Music’s future as royalty revenue and profit growth should continue.
Schneider Electric (SBGSY) +5.3%
Schneider Electric is a French multinational company providing energy and automated digital solutions for efficiency and sustainability. From the company’s Square D division selling circuit breakers to lighting controls for\ building management, the company is leveraging its power and energy management solutions to assist most all global companies. Schneider is benefitting from increased demand for its sustainable energy offerings.
Our thoughts on portfolio positions that had negative or the least positive impact on the strategy for the period ending 9/30/2021
Tencent Holdings -22.0%
Baidu.com (BIDU) -22.2%
Alibaba Group (BABA) -34.6%
New Oriental Education (EDU) -76.0%
As we discussed in our commentary, investing in China is unique, to say the least. The CCP in China makes decisions based on what they think is in the best interest of China. If they think forcing New Oriental to be a nonprofit is good for the people, then New Oriental is as good as gone. We have a new appreciation for the ground rules as long-term investors in still-growing China and we view the regulatory clampdown as a painful short-term negative, but a long-term positive. The runway for growth in China is still long. We feel like the worst of these challenges are behind us.
Holcim LTD. (HCMLY) -18.0%
It is hard to pinpoint any one thing that led to Holcim’s weakness this quarter. Many Euro Zone companies have experienced volatility, especially cyclical construction companies, like Holcim, due to Coronavirus’ concerns. We are impressed by cement volumes up 21% in the company’s 2Q, sales up 16%, and free cash flow up 9%. Holcim is at the forefront of innovation and sustainable building solutions, such as ECOPACT, the green concrete.
Final Thoughts
As we write this to you this quarter, it is storm season on our coast. Those of us who are fortunate to have property on the coast understand the tradeoffs that come during this time of year. We make preparations regardless of the path of hurricanes. We avoid unnecessary travel during this time in case we need to be here to batten down the hatches for a storm. We heed the red storm warning flags when they are posted.
Like hurricanes, we watch and prepare for financial storms that might hurt us. We appreciate the tradeoffs here as well that come from accepting somewhat lower returns in exchange for a safer, more conservative posture with our portfolio. We are still taking seriously a comprehensive report that was issued in May from the Federal Reserve about systematic vulnerabilities, more specifically, our equity markets. The report, which to us was similar to hurricane watch, distinguishes between shock and vulnerabilities, noting the latter “tend to build up over time and are the aspects of the financial system that are most expected to cause widespread problems in times of stress.” The report identified equity market valuations as a top financial vulnerability:
“Elevated valuation pressures are signaled by asset prices that are high relative to economic fundamentals or historical norms and are often driven by an increased willingness of investors to take on risk. As such, elevated valuation pressures imply a greater possibility of outsized drops in asset prices.”vsup>
Complex man-made systems, such as the economy or capital markets, are very difficult to forecast, not unlike extreme coastal storms. On rare occasions, the market can have a Category 5 storm that wipes out years of positive investment compounding. Forecasting uncertainty is impossible as uncertainty is a risk that can’t be quantified. As we saw after 9/11, the world of travel became less predictable and thus more fragile, a synonym popularized by Nassim Taleb, author of Antifragile. Some things benefit from shocks, and they thrive and grow when exposed to stress or disorder.VI
Both natural and human-made complex systems tend to become fragile when not regularly stressed. We both like to exercise daily, as we know a sedentary lifestyle and poor diet takes a toll on two guys in their 60s today. We need to stress our body, in a commonsense way, getting our heart rates up daily.
When thinking about the fragility of markets, the market hasn’t had its heart rate up very high in a while. Despite the 30% drawdown in March 2020, at the onset of the virus shutdown, the snapback was so quick, most market participants have felt comfortable with the bull market that risk assets have been in since March of 2009. We need periodic recessions and more frequent bear markets to act as guardrails against speculative excesses. We need an occasional shock to get us moving faster on our walks or swims.
Attempting to connect the dots between the era of the 2000s (the dot.com bust) and today, we remind you that markets declined for eight out of 12 quarters during 2000, 2001, and 2002. And for six consecutive quarters during the Great Financial Crisis in 2008 and 2009, the markets were also very weak. The virus stress test of 2020 lasted less than two months. We think about this and worry that investors might be too complacent and inadequately prepared for a true bear market. We will remind you that, absent two months in 2020 and the fourth quarter of 2018, the market has been in an uptrend for 12 years. It has been going up on the backs of the Central Bank intervention and a manipulation of interest rates to zero since 2008. Valuations are quite high.
How High?
Market cap to GDP is a ratio many of us use as a gauge of public market valuations. As the chart below shows, the ratio of all U.S.-based publicly traded equities to GDP, is over two times. Comparing this to 1.2 times during the peak of the dot.com bubble seems disturbingly high. But consider the second quarter of 2009 during the Financial Crisis low when public equities traded at 0.57 times GDP – this bothers us more, especially as most everyone is currently sitting at their lifetime high water mark of wealth.
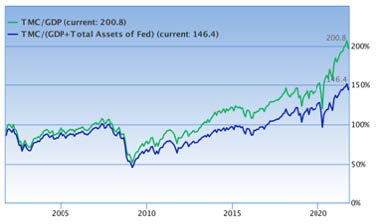
TMC = Total Market Cap
Human-made complex systems, terrorism, and hurricanes cannot be hedged away to avoid the unknown and unintended consequences of the future. Black Swans are rare, but history has proven their existence. Today, financial speculation is clearly pervading society as the Fed’s stimulus has led to record amounts of liquidity, increased use of leverage, individual investors’ crypto trading, SPAC issuance, bidding wars for homes…you name it.
Some market experts are referring to today as “The Everything Bubble.” Many say there is no alternative to negative real-return yields. Many can’t stand watching asset prices continue to appreciate around them. Many have moved far out the risk curve or capital market line chasing higher returns. Much of this activity and anecdotal evidence seems risky to us.
We remain constructive and “in the game” with our more conservative posture, allocation, and more value-priced portfolio. We are scanning the horizon for potential storms and Black Swans that could hurt our long-term wealth. Our team and our families are invested alongside you, and we don’t take our responsibility lightly in playing our role in your financial security. We continue to be humbled by your trust in us and remain grateful for your willingness to compensate us for doing something that we love to do and appreciate our partnership with you that is so important to us all. Our entire Live Oak Private Wealth team looks forward to our continued shared success together.
With warmest regards
Co-Chief Investment Officer
Co-Chief Investment Officer
Disclosures
- Past performance is no guarantee of future results and future performance may be higher or lower than the performance shown. The performance results for each equity sleeve are calculated for us by Orion Services and does not reflect investment management fees, custody and other costs or taxes. All of which would be incurred by an investor in any account managed by Live Oak Private Wealth.
- The performance attribution represented is a simple point-to-point price percentage change for the five best and five worst portfolio positions for the third quarter ending September 30, 2020 Each equity sleeve does not and is not intended to indicate past or future performance for any account or investment strategy managed by Live Oak Private Wealth. Additionally, there is no guarantee that all portfolios will own any or all of the companies mentioned.
- There can be no assurance that our portfolio management or any account managed by our investment managers will achieve a targeted rate of return or volatility or any other specified parameters. There is no guarantee against loss resulting from an investment.
- Investment objectives, returns, and volatility are used for measurements and/or comparison purposes only and are only a guideline for prospective investors to evaluate our investment strategy and the accompanying risk/reward ratios.
- Comparison to any index is for illustrative purposes only. Certain information, including index and benchmark information, has been provided by third-party sources, and although believed to be reliable, has not been independently verified and its accuracy cannot be guaranteed.
- The information contained here is not complete, may change, and is subject to, and is qualified in its entirety by, the more complete disclosures, risk factors, and other important information contained in Part 2A or 2B of Form ADV. This presentation is for informational purposes only and does not constitute an offer to sell or as a solicitation.
- Live Oak Private Wealth is a subsidiary of Live Oak Bank. Investment advisory services are offered through LOPW, LLC, an Independent Registered Investment Advisor. Registration does not imply a certain level of skill or training.
- Opinion and thoughts expressed are those of Bill Coleman and Frank Jolley and not Live Oak Bank.
- Not all portfolios will necessarily own all companies mentioned, due to factors such as legacy positions, capital gain constraints, sector concentration, time, and other considerations.
I Insight.factset.com
II Fbx.freightos.com
III Federal Reserve Data
IV Dawn Lin; BlackRock Tweaked Some Models. It Triggered a Wave of Buying and Selling. Wall Street Journal, July 9, 2021
V The Federal Reserves’ semi annual Financial Stability Report, May 6, 2021
V IAntifragile: Things That Gain from Disorder; Nassim Nicholas Taleb