
By: Bill Collier
“A 10% decline in the market is fairly common—it happens about once a year. Investors who realize this are less likely to sell in a panic, and more likely to remain invested, benefitting from the wealth building power of stocks” – Christopher Davis
Market Statistics as of 3/31/26

The first quarter of 2026 (Q1 2026) was a tale of two markets for many of the indices and very reminiscent of Q1 2025 where value stocks outperformed growth stocks and bonds. The markets were trending higher for most of the first quarter until the air strikes began on February 28 and the resulting peak to trough S&P 500 decline of 9.1% pushed the markets close to the 10% decline that Wall Street characterizes as a correction. We actually hit that level in early April but have regained much of those losses since then. We have said in many quarterly letters and calls over the years that these markets can move extremely quickly and violently in both directions depending upon headlines and how the algorithms interpret the data. We know that these minute to minute and day to day gyrations are usually not indicative of the true value of the underlying businesses we invest in. Therefore, we try to tune out much of the “noise” and look out for where we believe the earnings will be trending in the future. Earnings season is quickly approaching, and we will be listening to how the current situation in the Middle East is affecting our companies.
As you can see from the chart above, gold was the best performing asset in Q1 (just like Q1 2025) followed by mid caps (S&P Mid Cap) and value stocks (Russell 1000 Value). Within the S&P 500 market internals, energy led the way and was the only sector to post gains in March, (10.40%) and (38.20%) in Q1, its best quarter since Q1 ’22. Whether energy prices are higher for longer or based on the war is a major issue. Many oil pundits claim there is a worldwide glut of oil, but rig counts and global drilling suggest something different. Like we say, it takes two sides to make a market, and we are paying close attention to the matter. Materials (9.30%) was the next best sector followed by utilities (7.52%), consumer staples (7.01%), industrials (4.30%) and real estate (1.94%). On the downside, the financials sector (-9.80%) led the way and was followed by consumer discretionary (-9.34%), information technology (-9.25%), communication services (-7.10%) and health care (-5.29%).
Thoughts from Tiburon
“There is an excitable dog on a very long leash, darting randomly in every direction. At any moment, there is no predicting which way the pooch will lurch. He leaps randomly from one direction to the next, stops to smell every leaf, barks at other dogs. And jumps behind you for no reason. His movements are totally unpredictable.
But in the long run, you know he is heading northeast at an average speed of three miles per hour, because that’s where the owner is taking him. What is astonishing is that almost all of the market players, big and small, seem to have their eye on the dog, and not the owner.” – Ralph Wagner
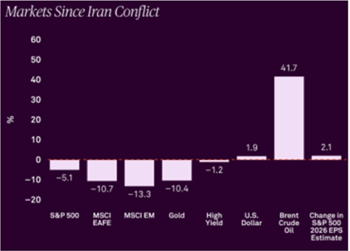
In February, the conflict with Iran increased market volatility. The analogy of Mr. Wagner’s quote is important to note during times of increased VIX. Said another way, stock price does not equal business valuation. Stock price reflects the valuation plus or minus current sentiment, which can create opportunities for investors. As reflected in the chart above, most asset classes declined following the onset of the conflict, with the exception of oil and the U.S. dollar. A key risk we continue to monitor is the potential impact on overall economic growth, particularly as higher gas prices affect broad segments of the economy. An important concern is whether higher interest rates will prove persistent. While expectations entering 2026 included approximately 50 basis points of rate cuts, current market pricing reflects no cuts, with some projections now pointing to potential rate increases. While moderate rate increases are manageable, returns tend to suffer if rates rise too fast or too high.
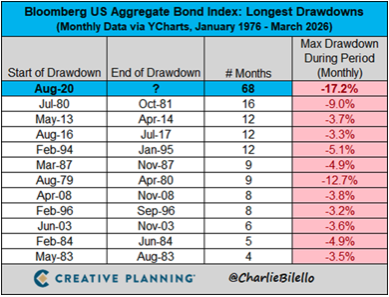
Market strategist Charlie Biello recently noted the US bond market has now been in a drawdown for 68 months, by far the longest in history, as illustrated in the chart below. This has resulted in additional losses for investors trying to stretch their maturities out further to increase their yields. Rest assured, we have taken and continue to take a very conservative approach to our fixed income investments with investment grade quality and short-term maturities being our strategy. We view our fixed income money as a safe haven, not meant for aggressive capital appreciation and undue risk.
For most of the past decade, the group of tech stocks called the Magnificent 7 (“MAG 7” ) have outperformed. The strength in this group made the term a household name. Recently, a new theme has emerged called HALO (Heavy Assets, Low Obsolescence). Highlighted by Goldman Sachs Research, the strategy targets businesses with significant physical assets that are difficult to replicate due to high costs, regulation, long build times, or engineering complexity, and that retain long‑term economic relevance. Examples include utilities, grids, pipelines, transportation infrastructure, critical machinery, and long‑cycle industrial capacity.
The valuation gap between capital‑intensive and capital‑light businesses has narrowed meaningfully. Although fund flows increasingly favor HALO assets, positioning remains relatively light as investors diversify away from crowded technology names. While rotation toward these sectors appears underway, long‑term allocations are still modest.
Technology remains overweight by historical standards, while sectors such as energy, utilities, and materials are underrepresented. Even a modest reallocation could drive significant upside, though the durability of this strategy in algorithm‑driven markets remains uncertain.
As we have said in many (maybe all) of these quarterly newsletters, our primary concern is protecting our clients’ capital while generating strong risk-adjusted returns that ensure peace of mind. We are constantly focused on the companies we invest in and are prepared to make the necessary adjustments when needed. Our investment team boasts a wealth of experience, having navigated numerous corrections and bear markets. Each market downturn is unique and usually the result of something not obvious, but they all are driven by fear and greed. We hope our experience and knowledge provide you with a sense of security and confidence. As always, thank you for your trust in us.
Portfolio Activity in the First Quarter 2026
Portfolio activity for the Value strategy was light with some trimming and adding to existing positions where our weightings were over or under our desired target sizes. We did exit a very small position in Solstice (SOLS), which was a recent spinoff from Honeywell (HON) and one we did not want to add to our Value strategy.
We added Lennar (LEN) to our Garp Model in January. LEN is the 2nd largest homebuilder in the US. LEN transitioned from a traditional builder into a capital light version by offloading long-term land development risks to third-party partners (like Millrose Properties). This “asset light” model allows them to control land with less money upfront. This should free up cash flow and in turn produce higher ROIC. We believe the current housing shortage will provide a long-term tailwind for this company.
Additionally, we trimmed our position in Alphabet (GOOG) in January. Google was and remains one of our top equity positions. The strength in the stock created an outsized position in some accounts. We continued to like the business, just thought it made sense to take some chips off the table.
In the International strategy we added London Stock Exchange (LSEGY). LESGY is a leading global financial infrastructure and data provider, like Bloomberg, S&P Global, and Intercontinental Exchange. With 44,000 customers in 170 countries, the company is integral to providing data and plumbing to the global financial system, utilizing a recurring revenue model. During the recent “SaaSmageddon” selloff, subscription-based software and data providers were broadly and indiscriminately sold. We viewed this dislocation as an attractive opportunity to initiate a position in a business whose earnings power is driven primarily by high-quality, recurring revenues.
DISCLOSURES:
This material is not financial advice or an offer to sell any product and is not a recommendation to buy or sell any particular security. Past performance is not indicative of future results. The opinions expressed are those of the Live Oak Private Wealth Management Investment Team. The opinions referenced are as of the date of publication and are subject to change due to changes in the market or economic conditions and may not necessarily come to pass.
Live Oak Private Wealth is a subsidiary of Live Oak Bank. Investment advisory services are offered through LOPW, LLC, an Independent Registered Investment Advisor. Registration does not imply a certain level of skill or training. More information about Live Oak Private Wealth, including our advisory services, fees, and objectives, can be found in our ADV Part 2A and/or Form CRS, which is available upon request.
This should not be construed as tax advice. You should always consult with your tax professional with regard to specific tax questions and obligations.