Author Archives: Live Oak Private Wealth

Download the final letter of 2020 to learn more about Live Oak Private Wealth’s portfolio activity, performance characteristics and comments from the team.

Introduction

“We have a lot of money. We need to get that money in Americans’ hands.”
-Treasury Secretary Steven Mnuchin 2020

“Forecasts create the mirage that the future is knowable.”
-Peter Bernstein


It is hard to believe this year is over. It has definitely been one for the history books in a lot of ways. Much will be recollected in many ways in year-end letters from the investment industry, so we won’t try and be too novel in our year-end thoughts. We can say it is exciting and feels good to be writing this as vaccines are being distributed. America’s future has always been bright, but 2021 is shaping up to hopefully deliver much more optimism.

2020 was a very good year for Live Oak Private Wealth, notwithstanding the challenges from the virus and the uncertainties around the election. We had what we consider solid investment results in line with long-term historical average returns. We were able to upgrade the quality of our portfolios during the depths of panic selloff in March. We refined and enhanced additional policies, procedures, and disciplines operationally, which has led to an even higher level of client service and commitment. We achieved two significant milestones: 1) we successfully merged Jolley Asset Management into Live Oak Private Wealth and integrated personnel and systems and 2) Live Oak Private Wealth became verified by the CFA Institute as compliant with the Global Investment Performance Standards (GIPS®).

Sophisticated investor demand drives product innovation, and the CFA Institute and the GIPS® standard ensures best practices for performance reporting and presentation. Adopted mostly by the top asset management firms, Live Oak Private Wealth is proud to be one of the few investment firms to be verified as GIPS® compliant. We should note that Frank and his firm have been compliant and verified for almost 20 years. The verification process was lengthy, arduous, and difficult. Client Service Associate, Missy Musser, took on this challenge and our entire firm is grateful for her efforts.

We hope you are finding our newly formatted quarterly letters beneficial. We are trying to mesh and combine 25 years of separate writing styles and methods into one cohesive, thoughtful communication. Why do we write these lengthy letters versus publish a “newsletter”? Writing is focused thinking put to words. We realize the format of this joint effort is different from what you have received in the past, but we feel like it is important for you to know what we invest your family’s money in and why. Again, we welcome your comments.

The market this quarter has been hot! Thomas Peterffy, the billionaire founder of Interactive Brokers, who first started trading on the now-defunct American Stock Exchange in the 1970s, says the current environment is unlike anything he has ever seen before. The euphoria surrounding stocks is clear for all to see, as Goldman Sachs recently pointed out on December 2 that the median S&P 500 stocks’ short interest is at its lowest level dating back to at least 2004. Similarly, Investors Intelligence Sentiment Data shows that market participants are the most bullish they have been since January of 2018. To put this level of bullish sentiment into perspective, it is the third-highest bullish reading in more than 30 years. The “everything rally” is the siren call that is drawing all in. Sentiment Trader noted recently in December the number of small traders (Robinhood and others) buying call option contracts as a percentage of total option volume is at record levels, outpacing levels seen during the 2000 tech bubble.

Wall Street loves a bull market. From our perspective, the IPO mania is back and if you can’t pull off an IPO, then just merge with a special-purpose acquisition company (SPAC)! It feels very frothy to us. Many newly minted IPOs are trading at 200 times… revenue! Not earnings. According to the Wall Street Journal, through September 30, U.S. venture capital funds have invested $88 billion, well above the $66 billion for all of 2000. As stated in last quarter’s letter, we are having certain feelings of déjà vu when considering 2020’s market with the 1999-2000 period.

Sanity will return. When you are in a bubble, it is hard to see. Given the valuations today with some of the tech highfliers, we believe an awful lot has to go right for a long, long time to justify today’s prices. Investing is not as easy as it appears to many these days. When investing seems this easy, it may be time to keep a sense of humility and try to maintain perspective that the “good” times may not last.

Market Review

It was approximately nine months ago when the S&P 500 Index lost a third of its value in about a month’s time. The equity markets were in bear market territory and coronavirus cases were surging. Restaurants, airlines, retail stores and theaters essentially went dark and unemployment was surging. We think it is safe to say that not one of our clients expected the markets to bottom on March 23 and for the S&P 500 to rally by some 68% into year-end. The S&P 500 ended the year at record levels and the NASDAQ Composite had its best year since 2000 with a 43.6% gain. The Dow Jones Industrial Average vaulted above 30,000 for the first time on November 24, up 60% from its March nadir. The markets’ dizzying rise in recent months has been powered by easy money provided by central banks, massive government stimulus, and the hopes surrounding the vaccines. All of the above happened as the U.S. economy is estimated to have contracted by 3.5% and S&P 500 earnings are estimated to have fallen by approximately 15%.

The past year was dominated by growth and mega-cap tech issues. The Russell 1000 Growth Index outperformed the Russell 1000 Value Index by 35.7%, the largest spread since 1979. Value did start to outperform growth in the fourth quarter as investors began to bet on an economic and profit recovery in 2021. Once again, the S&P 500 Index was driven by large-cap technology issues and returned 18.4%, while the S&P Equal-Weight Index returned 11. 5%. As was the case with the value indexes, the equal-weight index began to outperform the S&P 500 Index (market-cap weighted) by a considerable margin in the fourth quarter. In 2020, the market leaders were information technology (+42%), discretionary (+32%), and communication services (+22%). It should be pointed out that the discretionary sector is dominated by Amazon, while the communication services sector’s heaviest weightings include Alphabet, Facebook, Netflix and Twitter. When those factors are considered, you can easily conclude that technology was the dominant market theme in 2020. In the past year, market laggards were energy (-37%), real estate (-5%), financials (-4%), and utilities (-3%).

Index 2020 4th Qtr 2020 YTD 12 Months
DJIA 10.7% 9.7%
S&P 500 12.2% 18.4%
S&P 500 (equal weight) 18.6% 11.5%
S&P Mid Cap 24.4% 13.7%
Russell 1000/Growth 11.4% 38.5%
Russell 1000/Value 16.3% 2.8%
Russell 2000 31.4% 20%
NASDAQ Comp. 15.4% 43.6%

Growth Strategy

Commentary and Thoughts

Our objective and mandate for the Growth at a Reasonable Price strategy is to invest in good, growing companies and have the willpower and patience to hold our position for a long time to reap the value of compound growth. The majority of our best performance over the years has been a result of buying what we believe to be good companies and holding on. S. Allen Nathanson wrote a column in the late 1960s (before blogs and podcasts) and was known for his saying “Trade for Show, Hold for Dough.” Often, big returns are back-end loaded and you have to endure many peaks and valleys in a journey with a great growth business. We have endured long stretches of time where a stock went nowhere while others smoked by us in the fast lane. Media headlines screamed at us – challenging us to do something. Many times, it was best to sit on our hands.

We recently read an enlightening research piece from @mastersinvest regarding our appreciation for compounding with great growth stocks. Two things matter for the “magic” of exponential compounding to occur, high rates of return and longevity. Over the long run, just a few percentage points of differential in annual returns translates into staggering differences in financial outcomes.

But it is hard to patiently wait as capitalism is brutal. If you have a great, profitable and growing business, you will pop up on somebody’s radar, attracting attention and copycats, and your edge gets competed away. The key is finding a few rare companies that have defied the competition. They possess a rare, unique edge that stiff-arms the competition. Many times, we made the mistake and failed to appreciate the longevity of some growth stocks due to a myopic valuation discipline (since many of us cut our teeth as value managers, avoiding high P/E stocks). At times, we failed to have the appreciation of the durability and competitive advantages of say Amazon, Starbucks or Southwest Airlines who had very high growth rates in the early years (with very high P/Es) that we thought would fade due to the competition’s mean reverting forces.

Terry Smith, an investor we admire in London, made a great point in his new book called “Investing for Growth.” Smith states,

”The level of valuation which may represent good value at which to buy shares in a high- quality company may surprise you. The following chart shows the ‘justified’ P/E’s of a group of stocks of the sort we invest in.”
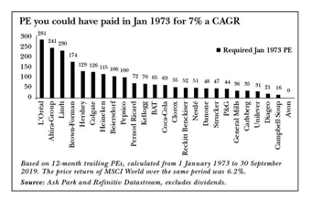
Considering the above, an investor who wanted to outperform the MSCI World Index from 1973 to 2019 would have required about a 6.5% return. Looking at the above table, it is astounding to think you could have paid 129 times earnings for Hershey or 281 times for L’Oreal and earned 7% compounded for 46 years.

We don’t seek out expensive stocks, but hopefully by knowing our companies well and holding a variant perspective (along with some willpower) regarding the durability and sustainability of growth and resultant future business value, we can remain invested in our compounders over many market cycles.

Fourth-Quarter Portfolio Activity

Trading was very light during the quarter, as the market literally traded straight up, with the only notable change was selling Schlumberger. Obviously, we, like many, treaded lightly into the election, expecting there to be potential volatility to act upon. Tax policy, regulations of high tech, global trade, and healthcare reform were all points of discourse in November. We held back, being cautious, expecting to deploy capital at lower prices during election volatility. Somewhat surprisingly, we didn’t get the volatility many expected (except for Connor, who said all summer the market was going to be wrong.)

The positive vaccine news and government stimulus ended up trumping the political election noise. The Biden proposal to increase the corporate tax rate to 28% and to potentially increase the capital gains tax rates hangs in the balance. We will be ready to add to a few of our stalwart companies should we experience significant downside volatility.

The quarter was busy with many virtual investor days. We participated with management in Lowes, United Health and Disney and came away quite comfortable investing alongside these great businesses. Reported third-quarter earnings for the majority of our companies were quite solid, and some were stellar like Fed Ex, Dollar Tree and Charter.

Contributors and Detractors For Growth Strategy

Our thoughts on portfolio positions that had the most positive impact on the strategy for the period ending 12/31/2020

Walt Disney Co. (DIS) (+47%)
Disney continues to effectively fight the coronavirus. Its diversified media platform resiliency coupled with the overwhelmingly positive response to its streaming video business, Disney +, remains one of the world’s most valuable companies.

Schlumberger (SLB) (+45%)
Schlumberger’s market-leading position in the energy engineering and consulting business provides some downside protection. Unfortunately, the company’s stock is too highly correlated with oil prices, which continue to be depressed by the pandemic and ESG mandates. We elected to finally sell our shares this quarter.

Charles Schwab (SCHW) (+41%)
Schwab owns a very valuable platform in the financial services industry and with the addition of TD Ameritrade, gains a scale advantage to add even more customers via low-cost service and leading technology.

HCA Healthcare (HCA) (+32%)
HCA Healthcare operates the largest network of hospitals in the U.S. focusing on attractive geographic locations, which provides what we consider a good positive demographic factor. With the end of the pandemic coming soon, along with effective vaccines, HCA has seen a pickup in elective procedures that had been delayed.

Wells Fargo (WFC) (+28%)
Wells Fargo continues to deal with unique headwinds: a regulatory-driven asset cap and bloated cost structure. New management is resolving these issues and improvements can materially improve the bank’s earnings. At its core, we believe Wells remains a strong commercial banking franchise with a large deposit base.

Our thoughts on portfolio positions that had negative or the least positive impact on the strategy for the period ending 12/31/2020

Air Products and Chemicals Inc. (APD) (-7%)
Air Products is one of the leading industrial gas suppliers globally, with operations in 50 countries and has a unique portfolio serving customers in a number of industries, including chemicals, energy, healthcare, metals, and electronics. Demand for industrial gas strongly correlates to industrial production, which should be favorable in 2021.

Lockheed Martin (LMT) (-7%)
Lockheed Martin is one of the highest quality defense prime contractors. Being the main contractor on the F-35 program with its 50-year contract lifespan coupled with its missile business, gives us comfort in the company’s long-term growth profile.

Lowes (LOW) (-4%)
Lowe’s posted its third consecutive quarter of double-digit same-store sales increases. The company continues to take market share benefitting from a 19% increase in building materials and garden equipment.

Moody’s Corporation (MCO) (-1%)
From our perspective, Moody’s Corporation and its credit rating agency remains well-positioned to take advantage of long-term trends such as banking disintermediation and continued development in global bond markets. The analytics side of the business enjoys a valuable subscription revenue model with high retention rates.

Verizon (VZ) (-1%)
Verizon’s strong position in the wireless business should bode well for continued stable revenue and cash flow. The wireless business is capital intensive and VZ is spending more than ever on additional spectrum for 5G. We will watch closely for shareholder return from 5G given these large capital outlays.

Classic Value Strategy

Commentary and Thoughts

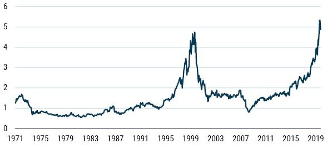
Last quarter, we stated that it was our expectation that the extreme valuation discrepancy between the most expensive and least expensive stocks would likely narrow as investors began to anticipate an improving economic environment. The pandemic had widened the disparity between the handful of winners and the rest of the market to what we thought to be unsustainable levels. Our belief that “value” strategies would begin to outperform “growth” began to unfold in the past quarter. For the quarter just ended, the Russell 1000 Value Index returned 16.3% versus 11.4% for the Russell 1000 Growth counterpart. The opportunity for value reminds us of the 1999-2000 period when the pendulum swung from growth to value. For the next ten years (following 12/31/99), the Russell 1000 Value Index outpaced the Russell Growth by approximately 6.5% a year, and the S&P 500 Index by 3.4% a year. In a recent letter (12/8/2020) by GMO, Ben Inker stated that “U. S. Value”—as GMO defines it—”now trades at the fourth percentile or relative valuation on the blend of metrics that we generally use to evaluate the group’s attractiveness.” If value stocks are cheap relative to the market, then the implication is that growth stocks are expensive. The chart below shows that on a price/sales basis, growth stocks are more expensive than they were in 2000.

Sources: GMO, Worldscope, Compustat, MSCI

The Hare and the Tortoise

A Hare was making fun of the Tortoise one day for being so slow. “Do you ever get anywhere?” he asked with a mocking laugh. “Yes,” replied the Tortoise, “and I get there sooner than you think. I’ll run you a race and prove it.” The Hare was much amused at the idea of running a race with the Tortoise, but for the fun of the thing he agreed. So the Fox, who had consented to act as judge, marked the distance and started the runners off. The Hare was soon far out of sight, and to make the Tortoise feel very deeply how ridiculous it was for him to try a race with a Hare, he lay down beside the course to take a nap until the Tortoise should catch up. The Tortoise meanwhile kept going slowly but steadily, and, after a time, passed the place where the Hare was sleeping. But the Hare slept on very peacefully; and when at last he did wake up, the Tortoise was near the goal. The Hare now ran his swiftest, but he could not overtake the Tortoise in time.

When examining investment styles, one could easily label the “value manager” as the Tortoise and the “growth manager” as the Hare. Currently, no one is giving the value manager (the Tortoise) much of a chance. The key to long-term compounding of money is the elimination of large drawdowns. We believe that investing with a “margin of safety” gives our clients the best chance to succeed over the long term. Value investing is not a simple philosophy to practice. Many who attempt or claim to be value-oriented fail to maintain the discipline or patience required to succeed. However, it is that very discipline and patience that enables the value investor to avoid getting caught up in speculative bubbles, even during periods of short-term underperformance. In investing, we believe that slow and steady wins the race.

Fourth-Quarter Portfolio Activity

The market essentially had a “melt-up” in the fourth quarter, as positive news about the COVID-19 vaccine trumped any political uncertainty. With the vaccine, investors and algorithmic traders began to factor in a reopening of the economy, which resulted in strong performance for many of the more cyclical areas of the market. Overall, our portfolio activity was light with most changes focused on year-end tax planning and account rebalancing.

We did add one position in the fourth quarter, International Flavors and Fragrances, IFF is a specialty chemical company and a market leader in the global flavors and fragrance industry. The company specializes in creating flavor and scent compounds, which it markets to consumer products companies for use in food, beverage, perfume, and consumer cleaning markets. IFF shares were added in mid-November and currently yields approximately 2.6%, making this a potentially attractive total return.

Contributors and Detractors For Classic Value Strategy

Our thoughts on portfolio positions that had the most positive impact on the strategy for the period ending 12/31/2020

Invesco Ltd. (IVZ) (+55%)
Invesco shares rallied as Trian Fund Management, led by Nelson Peltz, took a 9.9% position in the company. Trian has urged IVZ management to explore certain strategic combinations with one or more companies in the asset management industry. Invesco shares continue to appear attractive trading at 9 times projected earnings and yield 3.4%.

Disney (DIS) (+47%)
Despite problems at their theme parks and suspension of the annual dividend, Disney shares surged as the company has accelerated the pivot to streaming and the Disney + offering. DIS shares have also attracted activist investor Dan Loeb of Third Point Capital. We believe shares remain attractive long term as the company has the ability to successfully compete with Netflix in streaming and profitability should also see a boost as theme parks rebound in the second half of 2021.

Charles Schwab (SCHW) (+41%)
Schwab shares reacted positively to closing its acquisition of TD Ameritrade. The combined entity should realize approximately $2 billion in cost savings and be accretive to earnings in the range of 10% to 15% by year three. Going forward, SCHW should also benefit from higher net interest margins as interest rates move off of zero.

Sony (SNE) (+ 32%)
Sony shares have reached a multi-decade high as the company has rolled out its PlayStation 5 game console. We believe Sony is also well-positioned to grow its image sensor business, which is used in the smart phone market and autonomous vehicle market. Sony recently raised its annual profit forecast.

JP Morgan (JPM) (+31%)
JP Morgan shares had a strong quarter as investors anticipate a strong earnings recovery in 2021. After recent stress tests, the Fed is allowing JPM to resume buybacks and the company announced a $30 billion buyback in mid-December. We believe the shares remain attractive at approximately 13.6 times forward earnings and yield 2.7%.

Our thoughts on portfolio positions that had negative or the least positive impact on the strategy for the period ending 12/31/2020

Intel (INTC) (-5%)
Intel shares have been weak as the company’s third-quarter results missed expectations largely due to weakness in the Data Center group. Intel also recently reaffirmed the delay of its latest generation chips. The shares remain extremely cheap, trading at 11 times trailing earnings and yield over 2.5%. In recent weeks, activist investor Dan Loeb of Third Point Capital has taken a position in the company, calling on the company to explore strategic alternatives.

Dominion Energy (D) (-4%)
Dominion shares have essentially been tracking the electric utility group, which have lagged the market over the past year. The company recently completed the sale of its midstream natural gas operations to Berkshire Hathaway, reducing its debt load and repurchasing shares with the proceeds. The shares currently yield 3.5%.

Unilever (UL) (-3%)
Unilever shares have lagged the market in recent months, despite first-half earnings coming in better than analysts’ expectations. UL is a high-quality defensive stock trading at a discount to its competitor Proctor and Gamble. We believe Unilever is well-positioned to benefit growth in emerging economies. Unilever shares yield 3.2%.

Verizon (VZ) (-1%)
Verizon shares have trailed the market over the past quarter as earnings came in slightly below estimates due to COVID-19 challenges. We think the shares are an attractive total return vehicle with the shares trading at only 12 times earnings and yielding just under 4.3%.

International Flavors & Fragrances (IFF) (-1%)
International Flavors and Fragrances shares were purchased in the fourth quarter as the shares reacted negatively to a small third-quarter earnings miss. IFF shares have been weak over the past year as the company is in the process of acquiring Dupont’s Nutrition and Biosciences Division. Analysts expect a rebound in margins next year, which should lead to higher earnings. IFF shares yield 2.6%.

International Strategy

Commentary and Thoughts

Many analysts have commented lately that there may be more opportunities globally than in the U.S. We concur that valuations outside the United States are generally lower and therefore, potentially more attractive. As an example, as of September 30, 2020, the Shiller (CAPE) adjusted P/E ratio was 19.6 for Europe, 20.2 for Japan compared to 32.1 for the U.S. There has been outsized outperformance for the U.S. markets since 2008. When looking at longer periods historically, international markets cluster around very similar returns as the U.S. Returns have been higher in the U.S. recently due to the bifurcation of the S&P 500 Index and the effect of large-cap tech stock outperformance, but we appear to be on the verge of a shift back towards better international returns. Europe is quite tech light and heavier in sectors sensitive to economic performance. This has been driving our “barbell” approach to investing in technology stocks in Asia and value-oriented, cyclical, and industrial European stocks. Europe continues to fight the virus and is holding up quite well especially benefitting from the recent passage by the EU of an unprecedented stimulus package ($750B Euro European Recovery Fund). We obviously are watching closely the recent developments surrounding heightened regulations of Chinese internet companies.

We made no changes to the International strategy this quarter, other than adding slightly to Roche Holdings in a few accounts. We witnessed nice rebounds in Heineken and Euronet Worldwide as vaccine hopes buoyed their shares this quarter.

Contributors and Detractors For International Strategy

Our thoughts on portfolio positions that had the most positive impact on the strategy for the period ending 12/31/2020

Baidu (BIDU) (+71%)
Baidu is the largest internet search engine in China and generates the majority of its revenue from online marketing services. Baidu experienced what we consider a nice increase in ad spending as both Chinese user and advertiser activities within the Baidu ecosystem were more positive than expected.

Euronet Worldwide (EEFT) (+51%)
Euronet Worldwide is a global financial payments technology company with one of their leading businesses being ATM machines predominantly in eastern and southern Europe. Potential positive effects from the vaccines led to optimism of travel picking back up in Europe. Euronet also could be boosted by its successful modernization of digital payments systems for banks in India.

Safran (SAFRY) (+44%)
Safran is a France-based high technology company well known for its aircraft and rocket engines and propulsion systems. Safran’s stock was boosted by optimism of commercial travel resuming due to positive vaccine developments.

Airbus (EADSY) (+44%)
Airbus is a major aerospace and defense firm operating within a global duopoly with Boeing in the commercial aircraft market. Like Safran, Airbus stock was boosted by optimism of commercial air travel resuming due to positive vaccine developments.

DNB ASA (DNHBY) (+42%)
DNB ASA is a Norway-based financial institution providing mortgages, car, and consumer loans, savings and investments. DNB ASA was boosted this quarter by government bond yields increasing and the markets’ willingness to think that the worst is behind the banks related to the pandemic.

Our thoughts on portfolio positions that had negative or the least positive impact on the strategy for the period ending 12/31/2020

Alibaba Group (BABA) (-20%)
Alibaba is the world’s largest online and mobile commerce company. Alibaba is very large in financial services, logistics, and cloud computing as well. Alibaba’s stock is temporarily depressed due to the Chinese government’s antitrust regulatory guidelines as well as the suspension of the Ant Group IPO.

Sanofi (SNY) (-3%)
Sanofi has a lineup of branded drugs and vaccines that focus on areas such as diabetes, rare diseases, oncology and immunology. Sanofi is differentiated from its peers with its material emerging markets’ sales.

Unilever (UL) (-3%)
Unilever continues to invest in growing the brand power of its various products with more efficient marketing spending in an evolving retail landscape in which physical shelf space is becoming less important. The company has a favorable product mix and roughly 60% of sales come from outside North America and Europe.

Nestle (NSRGY) (-2%)
Nestle has transformed itself into a global nutrition, health, and wellness company. We believe Nestle’s global distribution network and entrenched supply chain relationships make it a formidable resilient growth company. Pricing power in its confectionary business has weakened slightly but should rebound as economies continue to open up.

Icon (ICLR) (-1%)
Icon is one of the larger contract research organizations (CRO) in the world and competes in one of the more lucrative CRO areas, long, complex trials with thousands of patients. We believe new business, as well as its backlog, remains strong as biopharma research continues to increase around vaccines and treatments.

The year 2020 will go down in history for a lot of reasons. Thinking back to this time last year, writing this same letter, we could not have envisioned or predicted the events of 2020. We will not start now forecasting and predicting what we think will happen in 2021.

We honestly have no idea what will happen in 2021 or beyond. Forecasting is difficult at best, particularly when it comes to financial markets – a domain in which the rules of the game are poorly understood, information is invariably incomplete, and expertise often confers surprisingly little advantage in predicting future market moves. We feel it is smarter to study history and we feel that our collective 75 years of investment experience has value. We have a deep appreciation for economic and investing history because it can help us calibrate our expectations for the future. Many times, all of us, investors or not, make decisions based on simplistic extrapolations of the past. If you can extrapolate anything from the past, it’s that the world is a surprising place and that we should use the surprises of this year as a guide and an admission that we have no idea what might happen next.

We obviously think deeply and deliberately about uncertainty and risk as it relates to your family’s money. We are in the decision-making business. We feel like we should strive for better decision outcomes based not on extrapolating history from the past, but on smart estimates of the future. Philip Tetlock, co-author of “Superforecasting: The Art and Science of Prediction” writes about reconciling two approaches to decision making: scenario planning and probabilistic forecasting. Each approach has a fundamentally different assumption about the future. Scenario planners have hundreds of imaginable ideas, but probabilistic forecasters look more at odds of possible outcomes and transform the uncertainty into quantifiable risk. Each of these methods has its strengths, in our opinion, but the optimal approach is to combine them.

At the end of the day, from our desks, we think deeply about the businesses we are invested in. We contemplate, discuss, and weigh probabilities against different scenarios that may unfold this upcoming year and beyond. Since we can’t predict what will happen with our stocks or the market, we continue to invest with a margin of safety so that forecasting is not necessary. Maintaining a margin of safety, or room for error, is the only way to navigate an uncertain world.

Investing your family’s wealth is not an endeavor we take lightly. Investing with a margin of safety drives everything we do – asset allocation, security selection and amount of cash reserves. Maintaining a healthy room for error will allow us to endure the range of potential outcomes that lie ahead.

Paramount to our philosophy and vision as your trusted advisors lies in the importance of a well-thought out goals-based wealth (financial) plan. By having this important plan or roadmap, we have already considered many future scenarios and have calculated probabilities incorporating historical returns, risk/reward tradeoffs related to your goals and objectives for your family. This plan helps us to define the proper amount of margin of safety needed. Think back to March of this year when we were all surprised by the pandemic panic selloff of 35%. That amount of volatility can be potentially very detrimental to investors without a plan and without room for error. Having confidence in what amount of a drawdown you can endure versus reacting emotionally and making a large mistake is the key to our planning relationship with you and your family.

We hope that you feel comfortable in knowing you have a plan and that your Live Oak Private Wealth team embodies the humility to recognize the difficulty in forecasting and therefore, has a plan for unknown future scenarios. Our plan would involve healthy communication and could lead to an asset allocation change or whatever adjustment may be needed. Our team will continue to invest your capital, as well as our own, with a margin of safety and room for error as we attempt to distill the uncertainties ahead into quantifiable risks to assess. The most important part of every plan is building in a margin of safety for the unexpected, which can happen more times than you may think. This is what we are here for, by your side, making sure we have room for error in what we can’t predict. We really love what we do for you and enjoy feeling secure in our curated investment portfolios we have thoughtfully constructed based on your goals and objectives.

We remain humbled and appreciative of your willingness to compensate us for doing something we love to do and is so important to us all. Our entire Live Oak Private Wealth team looks forward to our continued shared success in this partnership.

With warmest regards,

Frank G. Jolley, CFA
Co-Chief Investment Officer
J. William Coleman, III
Co-Chief Investment Officer

Disclosures

1) Past performance is no guarantee of future results and future performance may be higher or lower than the performance shown. The performance results for each equity sleeve are calculated for us by Orion Services and does not reflect investment management fees, custody and other costs or taxes. All of which would be incurred by an investor in any account managed by Live Oak Private Wealth.

2) The performance attribution represented is a simple point-to-point price percentage change for the five best and five worst portfolio positions for the fourth quarter ending December 31, 2020. Each equity sleeve does not and is not intended to indicate past or future performance for any account or investment strategy managed by Live Oak Private Wealth. Additionally, there is no guarantee that all portfolios will own any or all of the companies mentioned.

3) There can be no assurance that our portfolio management or any account managed by our investment managers will achieve a targeted rate of return or volatility or any other specified parameters. There is no guarantee against loss resulting from an investment.

4) Investment objectives, returns, and volatility are used for measurements and/or comparison purposes only and are only a guideline for prospective investors to evaluate our investment strategy and the accompanying risk/reward ratios.

5) Comparison to any index is for illustrative purposes only. Certain information, including index and benchmark information, has been provided by third-party sources, and although believed to be reliable, has not been independently verified and its accuracy cannot be guaranteed.

6) The information contained here is not complete, may change, and is subject to, and is qualified in its entirety by, the more complete disclosures, risk factors, and other important information contained in Part 2A or 2B of Form ADV. This presentation is for informational purposes only and does not constitute an offer to sell or as a solicitation.

7) Live Oak Private Wealth is a subsidiary of Live Oak Bank. Investment advisory services are offered through LOPW, LLC, an Independent Registered Investment Advisor. Registration does not imply a certain level of skill or training.

8) Opinions and thoughts expressed are those of Bill Coleman and Frank Jolley and not Live Oak Bank.

9) Not all portfolios will necessarily own all companies mentioned, due to factors such as legacy positions, capital gain constraints, sector concentration, time, and other considerations. This is not a recommendation to buy or sell a particular security. The holdings identified herein do not represent all of the securities purchased, sold, or recommended by the adviser.

10) Live Oak Private Wealth claims compliance with the Global Investment Performance Standards (GIPS®) GIPS® is a registered trademark of CFA Institute. CFA Institute does not endorse or promote this organization, nor does it warrant the accuracy or quality of the content contained herein.

11) To obtain information about GIPS®-compliant performance for Live Oak Private Wealth’s strategies or for a GIPS® report, please contact J. William Coleman, III at 910-839-8676.

As we write this letter, the U.S. Presidential election looms large. To discover our thoughts on the impact of the election results and more, read our latest Quarterly Letter.

Introduction

“We have a lot of money. We need to get that money in Americans’ hands.”
-Treasury Secretary Steven Mnuchin 2020

“Forecasts create the mirage that the future is knowable.”
-Peter Bernstein


Despite a weak September, stocks turned in a second consecutive quarter of dramatic gains. From the lows of March 23, 2020, the S&P 500 Index has rallied a staggering 53.4%. The market leadership continued to be narrow with most of the gains attributed to the mega-cap growth names (predominantly technology). The total return of the top fifty names (by market cap) is ahead of the bottom 450 names by 18.7% year to date. For the year, the Russell 1000 Growth Index has outperformed the Russell 1000 Value Index by just under 36%, the highest annual spread since 1979.

The market strength has essentially been driven by technology as investors are embracing companies that have benefitted from the “work-from-home economy” driven by the pandemic. For the nine-month period, the sector leaders have been information technology (+27.5%), consumer discretionary (+22.5%) and communication services (+7.6%). It is worth noting that the discretionary sector has been driven by Amazon, which makes up just under 42% of the sector; and the communication services sector has been driven by Alphabet and Facebook which comprise approximately 47% of the sector. It is safe to say that technology has dominated the market move. The weakest S&P sectors have been energy (-50.2%), financials (-21.7%), real estate (-8.90%) and utilities (-8.1%). As we discussed last quarter, the S&P 500 index has essentially become a mega-cap index, with the top ten names accounting for just under 29% of the index.

When one strips out the largest index holdings, you find that the broad market has struggled in 2020, as evidenced by the fact that the S&P 500 equal-weight index is down 6% year to date. The same message is evident when looking at the S&P Mid-Cap Index and the Russell 2000 Small Cap Index, which are down 8.62% and 8.69%, respectively. The Value Line Index, which is an equal-weight index comprised of 1,681 companies, is down 17.1%, well behind the major indexes. In summary, outside of mega-cap tech, 2020 has been extremely challenging for investors.

Index 2020 2nd Qtr 2020 YTD 6 Months
DJIA 8.22% -0.91%
S&P 500 8.93% 5.57%
S&P 500 (equal weight) 6.60% -6.00%
S&P Mid Cap 4.77% -8.62%
Russell 1000/Growth 13.22% 24.33%
Russell 1000/Value 5.59% -11.58%
Russell 2000 4.93% -8.69%
NASDAQ Comp. 11.02% 24.46%

The market continues to be boosted by the fact that the Fed has flooded the economy and the markets with liquidity and other forms of support for individuals, companies, and institutions. Additionally, the U.S. Treasury, along with the Fed, seems willing to provide support and stimulus well into the future. We spend a lot of time debating the sustainability of this massive support and liquidity by asking ourselves how long the Fed and Treasury can keep this up. If stock and bond prices are not based on fundamentals – such as earnings – but rather by the Fed’s buying of bonds and liquidity injections, then if and when this activity slows, how much could prices fall?

Those of us who have practiced our trade of managing portfolios for many decades have struggled with stock price transparency and discovery as easy money and constant stimulus have undermined the basic tenets of capital markets. As it was in the mid 2000s, society and the stock market look increasingly to the government for protection from major crises. Whether it’s a banking crisis, real estate bubble, garden variety recession or a health crisis, the reaction from the government (usually the Fed) has become almost automatic. It is probably a fair assumption and one we internally try to handicap, that the Fed will keep flooding the market with liquidity when something goes bump in the night.

In classical economic theory, this ”money creation” is considered problematic if it increases more rapidly than the available supply of goods and services. When more money is available to buy goods and services than supply, then prices increase. So, we worry about the government in essence “printing money” the way it is doing it at the moment. Will inflation again be problematic as in the 1980s? $26 trillion in U.S. federal government debt, and going up by the day, worries us when we think about how best to invest for you. Our investment team recognizes how heavy-handed government intervention is distorting the prices of high-flying growth stocks and most all bonds. We understand as well that this makes the free markets inefficient and our jobs more difficult in allocating your hard-earned capital.

So, as we write to you today, the talking heads on CNBC and the new found day-trading speculators rely on market aphorisms such as low rates justify high market P.E.’s and “Don’t fight the Fed.” Mathematically, low interest rates do justify higher stock valuations, for now. Maybe the massive amount of debt we have will keep them low as a necessity. We don’t know. But we do know that we are thinking about the longer-term consequences of such massive debt accumulation and the moral hazards of never-ending bailouts as it relates to keeping your money safely invested.

We are now wrapping up our second full quarter since Frank and the Jolley Asset Management folks joined forces with us. Our integration and transition have gone smoothly and effectively. We have learned a lot from each other already and are in the process of refining a collective investment process on the back of a sound investment philosophy that should stand the test of time.

Maybe we are old-school by our longer-term investment approach and discipline, compared to today’s speculators, who are trading stock options and chasing fast-rising stocks at record rates. There has been a tremendous surge in speculative option trading targeting the giant tech stocks we discussed earlier, and it has magnified the volatility late this quarter. According to Goldman Sachs, the volume of trading in single stock options recently (September) topped the volume of regular shares for the first time. Many large Wall Street investment banks must hedge their option positions which can accelerate violent swings in stock prices. More and more speculators seem to be chasing momentum, without regard to value. They are buying what is going up … Tesla, Apple and Zoom and selling what is falling, Exxon, Bank of America, and MetLife – activity that is amplifying the market’s move.

Focused Opportunity Growth

Live Oak Private Wealth Focused Opportunity Growth Strategy

COMMENTARY & THOUGHTS

Could this quarter’s speculative trading momentum be an echo boom from 1999? We have no idea and cannot predict the future, but we worry that the current tech stock dominance could end as it did in March 2000. Certainly, the day trading and option speculation today is very reminiscent of the late 1990s. But then again, there are large important differences between the market today and 1999. First of all, interest rates are much lower today compared to twenty years ago, theoretically supporting higher P.E.’s. We are also considering what we view as “accrued economic value” (based on revenues) generated by ten of the more significant contributors to market performance today. These ten large contributors include FANMAG1 plus Visa, United Health, Mastercard, and Home Depot. Comparing this basket of growth companies to a basket of the Russell 1000 Value top growers2, over the course of the last 10 years, we see almost 2.5 times more revenue and 2 times more net income.3 If this excess revenue and net income growth are an indication of underlying business strength, then these types of businesses are much stronger and maybe are more valuable. It could be considered by some that the market should assign a greater value to these top performing businesses. But, from a sheer market cap perspective as well as a valuation perspective, there should be limits as what a rational, disciplined investor should pay. Rest assured we are discussing this daily.

We were both managing portfolios during the 2000-2001 period of the Nasdaq tech bubble. We debate a lot about the current market structure compared to that period which cost investors (thankfully not us) a lot of money. We both feel like these current gigantic tech stocks might underperform going forward as their similar counterparts did in 2001. Should history not repeat itself, it will be based on valuations today versus then. Today’s big five tech stocks are earning a lot of money and collectively are trading at lower multiples than their counterparts in 2001.4

EV/EBITDA Multiple Trailing 5-year EBITDA Growth
Apple, Microsoft, Amazon, Google and Facebook June 2020 17.40% 27.00%
Microsoft, Intel, Pfizer, GE and Time Warner May 2001 30.60% 26.00%

Source – Bloomberg

As we wrapped up the third quarter, the markets took their typical “breather” during September. September and October have historically been downside volatile months. Investors have finally taken a harder look at the overconcentration in big tech and the very ebullient sentiment has cooled off. It appeared during the month of September there was finally a rotation or broadening out to other sectors. Our Focused Growth Opportunity portfolio had a good quarter, as the market in general continued to recover from the pandemic selloff as well as positive fundamental developments for a number of our holdings.

Portfolio activity was light in the quarter as we undertook only two portfolio changes in the model. We sold Axalta Coatings after a five-year holding period. Twice in the last several years, management turned down buyout offers in the mid $30s, above our cost. We elected to move on from this cyclical industrial, levered to the auto business in search of a better business. The other sale was tax related with Wells Fargo. We had elected to add to our Wells Fargo position in the first quarter when the stock fell to $29 and planned to sell our higher cost-basis position to offset earlier capital gains for 2020.

1FANMAG: Facebook, Amazon, Netflix, Microsoft, Apple, and Google
2Ten largest contributors for the Russell 1000 Value Factor, 2009-2019 (JP Morgan, Johnson & Johnson, Berkshire Hathaway B, Pfizer, Proctor and Gamble, Cisco, Intel, AT&T, Chevron, and Wells Fargo) Source: Revinitiv
3Source: Bloomberg
4Source: Bloomberg

Contributors and Detractors for Focused Opportunity Growth

Our thoughts on positions that had the most positive impact on the strategy for the period ending 9/30/2020

Federal Express (FDX) +61%

During the quarter, Wall Street sentiment turned dramatically bullish as it became evident the continued shift to E-commerce and delivery would benefit Federal Express. UPS benefitted as well but the re-rating of Federal Express was remarkable and proves that when sentiment changes on Wall Street, big moves can happen.

HCA Healthcare (HCA) +27%

During the quarter, HCA delivered better than expected second-quarter results. Key patient volume metrics started to improve as some elective surgical procedures ramped back up as the pandemic effects lessened.

Charter Communications (CHTR) +20%

Charter continued to show investors that its broadband internet offering is much more financially important than its cable video offering. Investors are continuing to recognize and appreciate the higher margin broadband service which is critical to work from home, learn from home, and new forms of streaming.

Berkshire Hathaway (BRK/B) +20%

Investors started to better understand what Berkshire’s potential pandemic liability was related to its exposures to insurance, banking, energy, and aerospace industries. Many of those fears from the second quarter abated and Berkshire’s earnings showed solid resilience and remains very cheap, selling slightly above book value coupled with over $130 billion in cash.

Abbott Labs (ABT) +19%

Abbott’s stock continued to be viewed favorably in light of their new Covid-19 antigen test, which is helping to increase the diagnostic testing capacity in the U.S. The company’s pediatric nutrition products as well as its glucose monitoring technology remain healthy and largely impervious to macro-economic conditions.

Our thoughts on portfolio positions that had negative or the least positive impact on the strategy for the period ending 9/30/2020

CVS Health (CVS) -10%

CVS Health continues to perform and execute well in our opinion. The company is at the intersection of all things important to healthcare; pharmacy, insurance, wellness, testing and soon to be vaccinations. Very reasonably valued with strong management allows us to be patient while the market comes around to this value.

Raytheon Technologies (RTX) -7%

Raytheon is now finishing up its first full quarter as a new company with its merger with United Technologies. Its aerospace business, which represent 50% of the company, is still temporarily under the pandemic cloud as many airlines are operating at diminished capacity. The defense contracting side of the business is solid with recurring contractual revenue. Widening out our investment timeline lens to 2022, we see good upside.

Wells Fargo (WFC) -6%

Wells Fargo continues to be the perennial under-appreciated financial stock. Sentiment towards the company from Wall Street and the public continues to be negative. Lower for longer interest rates and unknown loan losses from the pandemic loom large, but to us are already discounted. Trading at 70% of tangible book value allows us to patiently await better days for the stock.

Dollar Tree (DLTR) -2%

Dollar Tree’s shares got ahead of themselves during the second quarter as the market embraced the attractiveness of the dollar store model related to the pandemic. Dollar Tree continues to perform quite well and its duopoly with Dollar General should bode well for us in the future as its convenient locations, strong customer relationships and value focused defensive products keep it well positioned.

Bank of America (BAC) +4%

Bank of America continues to perform quite well in the face of Wall Street’s lack of interest in any financial stocks. Bank of America has a dominant franchise in the U.S. and its technology is the envy of the banking world, given their size. Catalysts for the shares in the future would include its depressed valuation, clarity of pandemic loan losses and a more normalized yield curve. Financial stocks (along with energy stocks) are very much out of favor in today’s market and viewing Bank of America with a contrarian’s lens gives us optimism of future higher prices.

Classic Value Strategy

Live Oak Private Wealth Jolley Classic Value Strategy

COMMENTARY & THOUGHTS

We find the current period eerily similar to the 1999-2000 period, where investors and traders went all in on technology, despite rich valuations. We realize that today’s technology behemoths are wonderful companies, with dominant competitive positions and high “barriers to entry.” As value investors, our goal is to invest with a “margin of safety”, which oftentimes requires us to step away from the crowd and focus on what could possibly go wrong. Is it possible that the pandemic pulled forward revenues and that this could normalize once the pandemic subsides and the economy re-opens? When we go back and look at the S&P 500 Index after the 1999-2000 period, we remind investors that the S&P 500 generated negative returns over the next decade. We believe that the price one pays for a security is just as important as which stock you purchase. Furthermore, you can buy the greatest company in the world, but if you pay too much, you will not receive a satisfactory return on your investment. Cisco Systems at the height of the dot-com bubble, in 2000, was briefly the world’s most valuable company with a market cap of approximately $550 billion. Cisco’s shares peaked at $82 per share in March of 2000 and bottomed two years later under $10 per share. Since July of 2000, Cisco has grown revenues from $18.9B to $49.3B and earnings from $2.7B to $11.2 billion. Despite that growth, today the shares trade at approximately $39 per share, down over 50% from the highs seen in 2000.

In our view, the extreme valuation discrepancy between the most expensive and least expensive stocks will likely be narrowed when we begin to anticipate an improving economic environment. The pandemic has widened the disparity between the handful of winners and the rest of the market. We believe our “value” strategy where we focus on risk and return will serve our clients well over the coming year.

Contributors and Detractors for Jolley Classic Value

Our thoughts on positions that had the most positive impact on the strategy for the period ending 9/30/2020

United Parcel Service (UPS) +46%

UPS is the world’s largest express carrier and package delivery company. UPS earnings surged in the latest quarter as the coronavirus pandemic has turbo-charged E-commerce sales. Under the leadership of new CEO Carol Tome, UPS momentum is expected to continue into 2021.

Mosaic Company (MOS) +48%

Mosaic is one of the world’s leading producers of concentrated phosphate and potash crop nutrients for the global agriculture industry. Mosaic shares reacted favorably to better than expected revenues and earnings this past quarter. We believe the shares remain attractive and expect a continued rebound in revenues and earnings in 2021.

Twitter (TWTR) +44%

Since our purchase of Twitter in the first quarter of 2020, the shares have attracted investments firms Elliott Management (activist investment firm) and Silver Lake Partners. A potential subscription model and better monetization of the platform could boost earnings and the share price over the intermediate term.

Qualcomm (QCOM) +31%

Qualcomm remains one of the best ways to participate in the widely anticipated rollout of 5G technology. Qualcomm recently received a favorable ruling in an FTC lawsuit lifting the shares. Analysts expect strong earnings growth in 2021.

Apple (AAPL) +31%

Apple shares have benefited from strong work-from-home trends which have boosted sales for most all of the Apple product line. Investors are willing to pay a higher multiple for the services business which has become a bigger part of the Apple revenue and income stream. We have been reducing our positions in Apple on strength.

Our thoughts on portfolio positions that had negative or the least positive impact on the strategy for the period ending 9/30/2020

Bayer (BAYRY) -20%

The German life sciences company that acquired Monsanto in June of 2018 has continued to face challenges in settling the litigation surrounding glyphosate (Roundup). Settlement efforts have stalled, despite the EPA reaffirming its position that there are no risks of concern to human health when glyphosate is used according to the label and that it is not a carcinogen. Bayer’s short-term results have also been impacted by weakness in the crop sciences business, largely driven by COVID. A recent analyst report from Bernstein suggested that the sum-of-theparts of the different business units could be worth 90-100% above the current share price.

Chevron (CVX) -18%

Energy stocks and oil prices have been dealt a devastating blow by COVID-19. The energy sector now represents only 2.1% of the S&P 500 index, down from 16% in 2008. Chevron is considered one of the strongest energy companies, however, any exposure to energy has been a drag to portfolio performance. Chevron shares yield 7.25%.

Cisco Systems (CSCO) -14%

For the recent quarter, Cisco revenues and earnings beat Wall Street expectations, but declined from a year ago due to corona virus induced weakness in the enterprise and commercial markets. Cisco’s balance sheet remains strong with $29 billion in cash versus $14.6 billion in total debt. Cisco trades at under 15 times trailing earnings and has an above average dividend yield of 3.8%.

Intel (INTC) -12%

Intel shares fell last quarter despite better than expected financial results. The markets are concerned about Intel’s competitive position with AMD and substantial delays on its development of cutting-edge 7-nanometer production technology. Intel trades at less than 10 times trailing earnings (versus 52 times for AMD) and yields 2.6%. Intel’s balance sheet remains strong with approximately $26 billion in cash.

CVS Health (CVS) -10%

CVS Health is also owned in the LOPW Focused Opportunity Portfolio. CVS shares trade at 9 times trailing earnings versus 22 times for the S&P 500 index. CVS shares yield 3.5%, so investors get paid to wait for a recovery in the shares.

International Strategy

Live Oak Private Wealth International Strategy

COMMENTARY & THOUGHTS

The third quarter saw the European countries continuing to improve and open further from the pandemic shutdown. Output contraction was pretty extreme in late spring as the majority of the Eurozone was closed for business, except for Germany. Stimulus has been provided as well as witnessed by the almost $1 trillion European Union Recovery Fund. This equates to almost 6% of European GDP and has been positive for our European investments. Asia and other emerging markets in the world continue to leverage their re-openings and most stock markets around the world have dramatically improved. Our eclectic International strategy is currently bar-belled between Europe and southeast Asia and is weighted towards E-commerce, healthcare, select financials and industrials.

Portfolio activity was robust as we sold Hollysys Systems International and we added three new investees: Heineken, Roche Holdings and Euronet Worldwide. Heineken has grown from its largely Western European roots to become one of the top brewers in the world and should benefit from the increased re-openings in the world. Roche Holdings is one of Europe’s preeminent biopharmaceutical companies specializing in cancer care and diagnostics, including testing for Covid-19 antibodies. Euronet Worldwide is a play on the eventual recovery in European travel. Euronet is a financial payments technology company with one of their main businesses being ATM’s predominately in eastern and southern Europe with an emphasis on tourist attractions.

Contributors and Detractors for International Strategy

Our thoughts on positions that had the most positive impact on the strategy for the period ending 9/30/2020

Alibaba (BABA) +36%

Alibaba continues to reward investors with growth in its retail E-commerce business and its cloud computing business is very strong. Runway for growth includes new models for digital manufacturing and delivery robots.

JD.com (JD) +29%

JD.com leverages its distinctive supply chain and technology capabilities to continue the company’s powerful growth in E-commerce. JD.com is the largest retailer in China and boasts a cross-border platform that enables brands worldwide to sell directly to Chinese consumers.

Ferguson (FERGY) +23%

Ferguson, the plumbing and heating firm, which generates 90% of its sales in the U.S., benefitted from a sizeable investment by an activist investor interested in separating operations to boost the stock’s value. As housing continues its bullish trend, Ferguson is a significant supplier gaining market share and growing.

New Oriental Education (EDU) +14%

New Oriental is evolving well, transitioning its 1,400 brick and mortar tutoring services business online, greatly expanding its reach and competitive advantage. Occupational test preparation and career education services for adults offers multiple avenues for growth.

Unilever (UL) +13%

The Anglo-Dutch consumer conglomerate maker of Dove and Ben and Jerry’s ice cream continues to benefit from increasing demand around the world as more countries re-open. Many of the company’s sustainable living brands that eliminate germs and provide cleaning solutions are growing in popularity.

Our thoughts on portfolio positions that had negative or the least positive impact on the strategy for the period ending 9/30/2020

Hollysys Automation Technologies (HOLI) -15%

Hollysys remains one of China’s leading industrial automation companies. The company is struggling with management issues and recent high-profile departures from the board affected shares. We have found the business harder to understand and have elected to sell out of our investment.

Development Bank of Singapore (DBSDY) -2%

The Development Bank of Singapore continues to operate well financially. The company, like most all financial and banking businesses worldwide, is coping with lower margins due to very low interest rates. The bank is one of the preeminent financial franchises in the highly populated and growing area of Southeast Asia.

Airbus (EADSY) Unchanged

Airbus continues to struggle as airlines around the world attempt to right size their fleet of aircraft, both new and existing to cope with the pandemic. Longer term, Airbus is well positioned in its duopoly with Boeing for the world’s aviation needs.

Safran (SAFRY) -3%

Safran, along with Airbus and Raytheon Technologies, continues to grapple with airline load factors as airlines around the world adjust to demand as the pandemic complicates travel. We have comfort in the company’s contractual recurring revenue service model for its thousands of engines in flight daily.

Sanofi (SNY) -2%

French pharmaceutical Sanofi just this month moved into Phase 3 trial for its Covid-19 vaccine candidate. Sanofi is one of the world’s largest maker of vaccines and the company should be well positioned with additional therapies for MS and other rare diseases.

As we write this letter, the U.S. Presidential election looms large. Typically, over the course of history, election outcomes haven’t materially affected the markets. While typically more volatile, stocks historically have been up 10% in the year following presidential elections, according to S&P data. We have had a lot of questions from clients and others related to this election and its range of outcomes and potential investment ramifications. Potential public policy changes could affect stock prices in 2021. The potential broad public policy changes that most likely will be considered important by the markets include globalization, anti-trust, broad tax, as well as many others. We believe it would be fair to understand that one of the many reasons for stock prices being where they are today relates to a political environment that is currently capital friendly, especially from a tax policy perspective. The Biden tax policy platform is publicly available and is considered by some to be potentially less capital friendly. We are neutral politically and therefore will stay laser focused on our portfolio companies and your valuable capital. Whether Trump or Biden is president, we doubt it will affect the iPhone business, boxes shipped on FedEx and UPS, Google searches, or Visa and Mastercard swipes.

Bernard Baruch coined an important phrase many years ago – “The main purpose of the stock market is to make fools of as many men as possible.” We fools, along with others much smarter, such as Jeremy Grantham (GMO); David Tepper (Appaloosa); Stanley Druckenmiller (Duquesne) view today’s market valuation and V-shaped full recovery in 5 months to be at odds with many macro-economic fundamentals. Uncertainty abounds. What jobs will still exist in the future? Will the vaccine work? How long will we work from home and will children stay in school? What will be the long-term effects on shopping centers and commercial real estate? Will the social and racial unrest stop? From our point of view, the most important question is will the political will remain for the massive stimulus to continue? We can’t know the answers to these important concerns, but we remain confident in the resilience of America’s companies and in our portfolios over the long term.

Investing is the art of positioning capital today so as to profit from future positive developments you expect. We are cautiously optimistic looking ahead to 2021 and beyond. We both believe strongly that the most important thing you can do to insulate yourself from perceived threats and uncertainty is to stay invested and maintain your long-term allocation that is tied to your goals and objectives. We also intend to stick to our discipline of finding competitively advantaged companies with strong, longterm growth prospects that trade for prices we believe will reward shareholders for sticking with them through good times and bad. We remain humbled and appreciative by your willingness to compensate us for doing something we love to do and is so important to us all. Our entire Live Oak Private Wealth team looks forward to our continued shared success in this partnership.

With warmest regards,

Frank G. Jolley J.
Co-Chief Investment Officer

William Coleman, III
Co-Chief Investment Officer

Disclosures

  1. Past performance is no guarantee of future results and future performance may be higher or lower than the performance shown. The performance results for each equity sleeve are calculated for us by Orion Services and does not reflect investment management fees, custody and other costs or taxes. All of which would be incurred by an investor in any account managed by Live Oak Private Wealth.
  2. The performance attribution represented is a simple point-to-point price percentage change for the five best and five worst portfolio positions for the third quarter ending September 30, 2020 Each equity sleeve does not and is not intended to indicate past or future performance for any account or investment strategy managed by Live Oak Private Wealth. Additionally, there is no guarantee that all portfolios will own any or all of the companies mentioned.
  3. There can be no assurance that our portfolio management or any account managed by our investment managers will achieve a targeted rate of return or volatility or any other specified parameters. There is no guarantee against loss resulting from an investment.
  4. Investment objectives, returns, and volatility are used for measurements and/or comparison purposes only and are only a guideline for prospective investors to evaluate our investment strategy and the accompanying risk/reward ratios.
  5. Comparison to any index is for illustrative purposes only. Certain information, including index and benchmark information, has been provided by third-party sources, and although believed to be reliable, has not been independently verified and its accuracy cannot be guaranteed.
  6. The information contained here is not complete, may change, and is subject to, and is qualified in its entirety by, the more complete disclosures, risk factors, and other important information contained in Part 2A or 2B of Form ADV. This presentation is for informational purposes only and does not constitute an offer to sell or as a solicitation.
  7. Live Oak Private Wealth is a subsidiary of Live Oak Bank. Investment advisory services are offered through LOPW, LLC, an Independent Registered Investment Advisor. Registration does not imply a certain level of skill or training.
  8. Opinion and thoughts expressed are those of Bill Coleman and Frank Jolley and not Live Oak Bank.
  9. Not all portfolios will necessarily own all companies mentioned, due to factors such as legacy positions, capital gain constraints, sector concentration, time, and other considerations.

Read the first quarterly letter following the addition of Jolley Asset Management to Live Oak Private Wealth and learn about our two distinct investment styles.

Introduction

“Hoping for the best, prepared for the worst and unsurprised by anything in between.”
-Maya Angelou

“We will not run out of money.”
-Federal Reserve Chairman, Jay Powell, 4/20/2020


As mentioned in our first quarter letter, Live Oak Private Wealth is privileged to welcome Frank Jolley and Jolley Asset Management into the family. Frank and his team have an impeccable reputation and outstanding long-term investment results. Frank and Bill will now be sharing the Chief Investment Officer role as well as the content for these quarterly letters.

One of the many reasons we merged our teams was the almost perfect alignment of investment philosophy between the two firms. Both of our firms are steeped in a conservative, capital preservation mindset. Yet strategy-wise, we have unique styles of portfolio construction, with Frank utilizing a traditional value investment style consistent with the classic value principles developed by Graham and Dodd in 1934. This value strategy (which can now be offered to all Live Oak Private Wealth clients) emphasizes a company’s financial strengths, first and foremost, and then seeks to invest in businesses trading at discounts to earnings, sales, and/or book values. Jolley’s legacy value strategy dates back to 1999 and has produced consistent, solid investment returns. What we will be attempting to do in these letters going forward is to share our collective thoughts around the investment climate and try to inform and educate you. Frank will contribute content specific to his style and portfolio and Bill will do the same for our growth and international portfolios. We welcome your comments and are grateful to have you as clients and privileged to share our thoughts with you.

Second Quarter Market Review

U.S. stocks just finished their best quarter since the fourth quarter of 1998, with the S&P 500 and Dow Jones Industrial Average returning 20.5% and 18.5%, respectively. It was a remarkable rally after the coronavirus pandemic brought businesses around the world to a virtual standstill. This was quite a contrast to the first quarter when major indexes lost approximately 35% in less than six weeks’ time. The rebound this quarter was driven by massive stimulus by the Fed and the CARES Act, which has an estimated cost of $2 trillion. U. S. stocks beat all other asset classes in the second quarter, including gold (+9.5%), corporate bonds (+9.3%), cash (flat), and long-term government bonds (-0.5%). All eleven sectors were up in the quarter, led by discretionary (+33%), technology (+31%), energy (+31%), and materials (+26%). On a year-to-date basis, only technology (+15%) and discretionary (+7%) were in positive territory. The worst performing sectors year to date are energy (-35%) and financials (-24%). For the year, the Russell 1000 Growth Index has trounced the Russell 1000 Value Index by 26%, which represents the widest annual spread in the Russell Index history (1979). The market rally slowed towards the end of the quarter as there has been a resurgence in coronavirus cases in parts of the U. S. and the civil unrest sparked by the killing of George Floyd. The economic picture remains bleak, with approximately 20 million jobs lost since February. Looking ahead, a Democratic sweep of the White House and Congress looms as a potential risk as a Democratic-controlled government would roll back tax cuts that were enacted in 2017, which would pressure profit margins. Goldman Sachs has estimated that the Biden tax plan would cut corporate earnings by 12%.

The market’s massive move off the bottom of March 23 has confounded most observers and probably many of you. This mystery of the markets puzzles many due to a perceived disconnect between dismal economic statistics, tens of millions unemployed and many afraid to even leave their homes, and a stock market almost back to where it was before the virus.

The notion that stock market returns and economic data are closely linked seems intuitive, but in reality:

  • Stocks are driven by earnings, not real growth in the economy or employment. Some companies can grow earnings even in very troubling times, and their stocks rise.
  • The economy many link the stock market to does not always relate to the United States. Globalization has made it possible for companies to prosper in other geographical areas not affected by a crisis or a bad economy.
  • Stock markets are discounting mechanisms or prediction machines in the short term, and typically there will be a six to nine month lag between markets and the economy.

With that said, many (including us) have been very surprised at the way the market roared back. Even Warren Buffett, who has always preached to “be greedy when others are fearful and fearful when others are greedy,” didn’t do much buying during March. Psychologists have documented that most people can’t tolerate losing and feel pain from a loss twice that of the pleasure of a gain. Therefore, most can’t tolerate the pain of stocks declining and sell and cut their losses.

One of the longest-running adages on Wall Street is, “You can’t fight the Fed.” Since March 23, investors have placed a great deal of confidence in the ability of the Federal Reserve and Treasury to engineer a recovery from this virus. The Fed has stepped up in a big way the purchases of bonds, which puts money in the hands of sellers and that money has to be reinvested. The reinvestment process, in turn, drives up the prices of bonds further (and indirectly stocks) while driving down interest rates and expected returns. The lower interest rates go, the lower the discount rate used to calculate a company’s future equity value. This can argue for higher stock valuations. Lower bond yields also offer less competition to stocks. What would you rather have for ten years, UPS stock with a 3.6% dividend or a UPS bond for 1.34%?

But now what? Have we come too far too fast? Have the massive inflows of Fed-driven liquidity acted as steroids for the market? By most measures, the market is quite expensive and momentum is driving things at the moment. Market participants are quite optimistic all of a sudden and may not appreciate the potential negatives that could loom ahead with the reopening of the economy, consumer confidence and the election risks.

Our concern is that volatility will only increase from here. Volatility trading on Wall Street, which we have discussed here too many times to mention, has grown so big that trading on expected market moves can itself move markets. In these letters, you have read our concerns about the market “structure,” which refers to the sheer amount of money traded by computers (machines) without rational human involvement. Today’s economic uncertainty means volatility trading, and therefore volatility itself is likely to stay elevated.

An investor we admire in Charleston, S.C., recently referred to what we experienced in March as analogous to a hurricane. He asked if we are in the eye now, or if the storm has passed completely? Shouldn’t we prepare maybe for the backside of the hurricane, which could be worse than the front? Now that we have recovered most of the losses from March, isn’t it time to analyze where you stand? Isn’t it time to revisit your specific goals and objectives for your money and re-check your positioning? If what we went through in March was too concerning for you, this is now the perfect time to reassess your risk tolerance. A little time spent now with one of our experienced certified financial planners might go a long way in helping you suppress the emotional side of investing.

Portfolio Discussion

PORTFOLIO(S) DISCUSSION AND COMMENTARY

Market Statistics as of 6/30/2020

Index 2020 2nd Qtr 2020 YTD 6 Months
DJIA 18.50% -8.40%
S&P 500 20.50% -3.10%
S&P 500 (equal weight) 21.90% -11.80%
S&P Mid Cap 24.10% -12.80%
Russell 1000/Growth 27.80% 9.80%
Russell 1000/Value 14.30% -16.30%
Russell 2000 25.40% -13.00%
NASDAQ Comp. 30.60% 12.10%

With the wonderful addition of Jolley Asset Management to Live Oak Private Wealth, our enhanced investment team now manages two distinct investment styles or strategies (Value and Growth at a Reasonable Price [GARP]) in addition to our international strategy. All are principally grounded in a conservative mindset with capital preservation and growth and income as objectives. Below we will break out separate commentary from Frank and Bill related to the markets and other varying portfolios.

Classic Value Strategy

Live Oak Private Wealth Classic Value Strategy Commentary and Thoughts (Frank Jolley) :

“The four most dangerous words in investing: This time it’s different.”
– Sir John Templeton

Is The S&P 500 Just a Mega-Cap Index?

While the second-quarter rally brought the S&P 500 Index within striking distance of where it began the year, the average stock has fared much worse. As of mid-year, 24 of the 30 Dow Jones components are down on the year and only six have generated positive returns.

The average stock in the Dow Jones Index is down approximately 10% for the year. As of June 30, the S&P 500 was down 3.1%, while the S&P 500 equal-weighted index was down 11.8%. As of July 3, 2020, the median stock in the S&P 500 was down 11%. Keep in mind, both indexes are comprised of the same 500 companies, however the S&P 500 Index is market-capitalization weighted, while the equal weight version holds equal amounts of all 500 companies. In a nutshell, the bigger, more expensive companies are performing better than the smaller, less expensive counterparts. According to a report from Bianco Research dated July 13, 2020, the S&P 500 Index is the most concentrated it has been in the last fifty years. The top five names in the index (Microsoft, Apple, Amazon, Alphabet, and Facebook) currently comprise just under 25% of the S&P 500 Index, and the top twenty names comprise over 38% of the entire index. As Carter Worth of Cornerstone Macro recently stated (July 8, 2020, on CNBC), “There is no S&P Index anymore. It’s just a few names.” To put things into perspective, the top 3 stocks by market cap represent 16.6% of the S&P 500 Index, which is a greater weighting than the bottom 300 names in the index. Along those same lines, the top 5 names in the index currently have a higher weighting than the bottom 350 names in the index, and the top 15 names have a market cap equal to the bottom 420 names.

S&P 500 Median Results (7/3/2020)

Source: Ycharts

Company Size P/E P/S P/B YTD Returns
Top 10 31.4 6.3 6.3 9.6%
Top 50 28.7 4.6 5.5 2.4%
51-100 26 3.8 5.3 (5.7%)
101-150 22.9 3.9 4.1 (1.9%)
151-200 26.4 3.0 4.1 (6.7%)
201-250 24.4 2.6 3.2 (9.3%)
251-300 23.2 2.6 3.3 (5.5%)
301-350 23.9 2.8 2.5 (8.5%)
351-400 22.1 1.8 3.0 (17.6%)
401-450 13.3 1.4 1.9 (22.6%)
451-505 13.9 0.8 1.2 (38.5%)
S&P 500 22.8 2.4 3 (11.0%)

The chart above probably does the best job of explaining the S&P 500 returns for the first half of 2020. The biggest companies by market capitalization are the most expensive based on valuation metrics such as P/E (price/earnings ratio), P/S (price/sales ratio), and P/B (price/book value ratio). The biggest companies have also produced the highest market returns, despite those higher valuations. The move higher in technology issues, while the rest of the world moves lower, seems unsustainable given current valuations. James Mackintosh, of the Wall Street Journal, on April 21, 2020, stated that “Stocks listed on the NASDAQ are worth as much as the MSCI World ex-USA Index, a benchmark that includes 1007 large and mid-cap stocks from developed markets outside the United States with a median market capitalization of $5.8 billion.“

Investment or Speculation?

In the typical economic recession, market participants traditionally attempt to hunker down, reducing portfolio risk and playing defense. During a market drawdown, such as was experienced in the first quarter of 2020, it is not unusual for investors to panic and/or capitulate. Even seasoned market professionals typically reposition portfolios to reduce risk to ensure that losses don’t become unmanageable. While certainly some investors panicked out, what has taken place since then is nothing short of amazing. As individuals were told to “stay at home” and that the government would help with a $1,200 stimulus check and enhanced unemployment benefits, it appears that quite a few became bored and a chunk of the money found its way into the equity markets.

Many inexperienced investors sensed a “generational buying opportunity,” evidenced by 1.2 million new account openings at Fidelity and Robinhood and trading volumes up by three-fold when compared with 2019. Ironically, this was going on when one might expect mutual fund liquidations and people exiting from the markets. Millennial investors (who some call speculators) have been attracted by a trading app that makes buying and selling stocks simple and free. The average Robinhood trader is thirty-one and trades forty times as many shares per dollar than the average Schwab customer. As pointed out by Nathaniel Popper in a New York Times article dated July 8, 2020, Robinhood encourages more trading as it gets paid by selling the order flow to various Wall Street trading firms like Citadel Holdings. With interest rates at zero and 80% of the S&P 500 index paying higher dividend yields than the ten-year treasury bond, perhaps investing is a wise move for people seeking some type of return on their money? It turns out that most Robinhood accounts are invested in speculative securities rather than dividend-paying securities.

While there is nothing wrong with speculation under appropriate conditions, we do not think it should be confused with long-term investment strategies. In the Intelligent Investor (published 1949), Benjamin Graham stated, “An investment operation is one which upon thorough analysis, promises safety of principal and an adequate return. Operations not meeting these requirements are speculative.” Could the speculative trading on Robinhood be a form of entertainment/gambling? After all, the June 2020 unemployment rate is 13.3% (Bureau of Labor Statistics says true rate is over 16%). That, coupled with the fact that half of the workforce is now working from home, might help explain this newfound love for trading on the Robinhood platform. Some top stocks include companies such as Nikola, Workhorse Group, Ideanomics, Top Ships, Tesla and Hertz. Nikola’s (electric truck manufacturer) market cap recently exceeded that of Ford Motor Company even though they have yet to sell a truck. Hertz, which rallied some 883% after filing for bankruptcy, is another Robinhood most traded issue. In English folklore, Robinhood was an outlaw who took from the rich and gave to the poor. When looking at how they are selling their order flow, it appears that Robinhood takes from the millennial and gives to the high-frequency trader. While we are not here to judge Robinhood traders and/or the Robinhood platform, we are merely pointing out that this is not the typical behavior one sees when the economy is mired in recession. The current period is eerily similar to the 1999-2000 period when day-trading was all the rage and valuations were deemed irrelevant.

Steadfast Course of Action

While writing this section of this letter, we took some time to review the quarterly letters we sent to clients in 1999 and early 2000. While history doesn’t always repeat itself, it often rhymes. The similarities of the two periods include not only the day-trading mentioned above, but includes many other parallels such as: 1) divergent returns between S&P 500 index and S&P 500 equal weight index, 2) top heavy S&P 500 index with largest names (mainly technology names) driving the index, 3) the tech heavy NASDAQ generating outsized returns, while average stock was in a bear market, 4) media infatuation with technology highflyers, 5) some of the highest market returns coming from unprofitable companies, 6) 1999 analysis focused on “eyeballs” while 2020 market focuses on TAM (total addressable market) and, 7) investment legends such as Warren Buffett, Grantham etc. deemed to be washed up and done. Below is an excerpt of our Investment Outlook from January of 2000 and in our judgment continues to be relevant today:

Jolley Asset Management is a disciplined value investor. We believe that in the long-term stock prices are ultimately driven by the earnings and cash flow of a business, and the risk in that enterprise is largely related to the sustainability of those cash flows. The company’s competitive position is extremely important, and we prefer to buy companies where we believe the business franchise offers us a “margin of safety.” While we pay attention to relative risk, we are more concerned with absolute risk when we purchase a security. We are just as focused on the balance sheet and downside as we are the potential for capital gains. We also believe that dividends are an important component of total returns. The bifurcation of today’s markets creates wonderful buying opportunities to the contrarian value manager, such as Jolley Asset Management. We believe we are at a critical inflection point, where an investor must be willing to swim against the tide, even if it means foregoing short-term performance. It is our belief that great long-term investment records are made by making tough decisions, which many times may mean going against the herd mentality. Buying what is popular has never worked on Wall Street. That is precisely why Jolley Asset Management was formed, to provide a vehicle whereby our focus and discipline could be preserved. We firmly believe our clients will be rewarded handsomely.

As we have communicated with you over the past few months, our excitement over our combination with Live Oak Private Wealth is largely based upon the similarities in our investment philosophies and the quality and integrity of the people. After our first full quarter as part of the Live Oak Private Wealth team, I can honestly say I feel even stronger that this combination will prove to be extremely positive for our clients. Thanks again for the confidence you have placed in our firm.

Ten Largest Positions
Live Oak Private Wealth Classic Value Strategy
June 30, 2020

Sony Corp
Intel Corp
Qualcomm, Inc.
Dominion Energy
Alphabet Inc., CI A

United Parcel Service, Inc.
Cisco Systems, Inc.
ServiceMaster Global Hldgs, Inc.
CVS Health Corp
Merck & Co., Inc.

During the second quarter of 2020, we initiated a position in Charles Schwab (SCHW). This is a company that we are extremely familiar with, as they serve as our primary custodian for client assets. Schwab recently announced that is acquiring TD Ameritrade, which should add scale and cost synergies. Schwab shares have recently been under pressure (34% off 52-week high) due to the fact that earnings will be depressed by the zero-interest rate environment. We also initiated a position in Unilever during the past quarter. Unilever (UL), is headquartered in the Netherlands and is a global consumer goods company. Unilever has a 3.2% dividend yield and trades at a large discount to Procter & Gamble on a valuation basis. During the quarter we exited our position in Loews, a conglomerate which operates in the hotel, property and casualty insurance and energy industry. All these sectors face major headwinds due to COVID-19.

Performance Attribution
Live Oak Private Wealth Classic Value Strategy
June 30, 2020**

Top Five Performers

Bottom Five Performers

Apple +51% Berkshire Hathaway B +1%
ServiceMaster Global Hldgs +40% Pfizer, Inc +3%
Applied Materials +40% Verizon Comm +4%
Qualcomm, Inc +38% Merck & Co., Inc +5%
Invesco Ltd +34% Coca-Cola +6%

Focused Opportunity Strategy

Live Oak Private Wealth Focused Opportunity Growth Strategy – Commentary and Thoughts (Bill Coleman):

After the wild market action from the first quarter, we sat idle for the second quarter. We, of course, are constantly engaged in our typical daily research routine; reading research reports and white papers and listening in on numerous conference calls with managements and many educational podcasts. Travel has been limited for now, but we have been engaged in reviewing second-quarter company earnings and management presentations.

Trading activity was much lighter than the first quarter. The only activity was selling two spinoffs we received from the Raytheon/United Technologies merger. Those two spinoffs were Otis Elevator and Carrier Air Conditioning. We debated doing a deep dive into each and contemplated adding significantly to these small positions and making them key players in the portfolio. However, after much consideration, we sold them and opted to focus on more attractive businesses we know better, as well as replenish some of the cash we invested in March.

The incremental investments we made in March have helped our portfolios to a varying degree. While it is not fair to grade them yet, we will attempt to anyway. When the selling started in earnest around March 6, the earlier purchases we made in Disney on March 10 and Markel on March 11 have not really earned us much yet. As the selling intensified into the middle of March, the additional investments made in Mastercard and Berkshire Hathaway have helped more, and the Microsoft addition was fortunately made closer to the bottom. The ultimate outcome of these decisions will not be known for several quarters. Patience and timing are very important in portfolio allocation decisions, and looking back, we feel pretty good about the decisions. Our number one objective was to increase the quality of the portfolio on the weakness. We did that, maybe not at the bottom on March 23, but at reasonable prices that will hopefully generate solid returns in the future.

We have a few positions on our watch/sell list. We will either be trimming the position sizing out of price discipline or selling outright and looking for better risk/reward opportunities.

Ten Largest Positions
Live Oak Private Wealth Focused Opportunity Growth Strategy
June 30, 2020

Microsoft
Berkshire Hathaway
United Healthcare
Mastercard
Google Alphabet CIC

Disney
Apple
Charter Communications
Federal Express
Bank of America

Performance Attribution
Live Oak Private Wealth Focused Opportunity Growth Strategy
June 30, 2020**

Top Five Performers

Bottom Five Performers

Carmax +51% Wells Fargo -4%
Apple +51% Comcast 0%
Schlumberger +46% Berkshire Hathaway +1%
Axalta Coatings +38% Charles Schwab +2%
Microsoft +34% Verizon +4%

International Strategy

Live Oak Private Wealth International Strategy Commentary and Thoughts (Bill Coleman):

International stocks advanced during the quarter, led by information technology, consumer discretionary, and the communication services sectors. Outperformance in companies we own in Chinese social commerce played a key role in our quarterly performance. JD.com and Tencent Holdings continue to offer positive growth from network effects and consumption growth in China. In the Eurozone, Schneider Electric and Ferguson offset weakness from the aerospace sector’s investments in Airbus and Safran. Non-U.S. equity valuations were attractive before the coronavirus outbreak and are now even more so in this bifurcated, mega-cap tech weighted U.S. market. There are many incredibly successful and competitive companies based outside the U.S. Our long-standing position in Nestle, coupled with consumer stalwart Unilever offer “blue chip” characteristics and good relative dividend yields. In Europe, where weak travel and tourism are crucial segments of the economy, there have been bright spots nonetheless with Linde, the industrial gas business and pharmaceutical companies Sanofi and Novartis racing towards vaccines for the virus.

Trading activity for the second quarter was light. We exited Fiat after pending changes from the large merger with Peugeot eliminated the special dividend we expected. Also, our thesis behind our investment in Exor was weighted heavily towards the divestiture of PartnerRe, which was scrapped this quarter due to the coronavirus. Our investment thesis in both of these changed dramatically and our discipline triggered the sales.

Ten Largest Positions
Live Oak Private Wealth International Strategy
June 30, 2020

Nestle
Alibaba
New Oriental Education
Vivendi
JD.Com

Tencent Holdings
Ferguson
Linde
Airbus Group
Safran

Performance Attribution
Live Oak Private Wealth International Strategy
June 30, 2020**

Top Five Performers

Bottom Five Performers

Siemans AG +49% HLS Systems +4%
JD.com +47% Novartis +8%
Lanxess AG +44% Nestle +9%
Ferguson +43% Unilever +12%
Schneider Electric +41% Alibaba +15%

Final Thoughts:

Notwithstanding the surprising V-shaped snap back in stocks we witnessed this quarter, it is still a challenging time for us as investors. It has been an even more challenging time for teammates, friends and families. Each of us on our team is striving to keep ourselves, our families, and our colleagues as safe as possible. We continue to function at 100% while still choosing to work at times remotely. We are intellectually “all-in” and all hands-on deck, because the essence of what we do is safeguarding client assets and investing them prudently and we remain laser-focused.

Challenging times in markets and with money like we have witnessed, reminds us how fortunate we are to have such a strong group of investors like you. Many of our friends and acquaintances at other firms in our industry were bombarded with calls from panicked investors with finicky capital, while the majority of the calls we received were from clients looking to increase their relationship with us. We are very fortunate to have a group of high-quality clients that understands what we do, has the confidence to let us do it, and the courage to add capital to their accounts when many others are fleeing in fear.

So, as we continue to endure the fits and starts and openings and closings on the back of a lot of recent optimism in the markets, questions and concerns remain present.

  • What are the possibilities, timeline, and efficacy for a vaccine for the novel coronavirus?
  • Where will the impacts be on the economic recovery if the return to work is slow and many small businesses never reopen, and millions of jobs are permanently lost?
  • What are the impacts of potentially permanent change in the world of retail, shopping centers, office buildings, travel, and sports?
  • What are the potential election risks to political and financial considerations that would alter the Federal Reserve and/or Treasury efforts to provide stimulus to combat a further slowdown?

The markets have rallied a lot and have gotten very optimistic in our opinion. Possibly, the markets are not looking ahead far enough to gauge the concerns noted above. We believe a majority of the rally has been driven largely by the Federal Reserve’s liquidity actions and the Treasury’s stimulus payments. This “bridge” has been tremendously important, but we don’t know how long the bridge needs to be. Stock prices feel like they are ahead of themselves, especially with the election uncertainty looming. We end the quarter with an eye towards caution and thinking defense versus offense.

We find ourselves again humbled and appreciative by your willingness to compensate us for doing something that we enjoy doing (even in turbulent times) and is so important to us all. Our entire Live Oak Private Wealth team looks forward to our continued shared success in this partnership.

With warmest regards,

Frank G. Jolley
Co-Chief Investment Officer

J. William Coleman, III
Co-Chief Investment Officer

Appendix

Live Oak Private Wealth Investment Philosophy

Three Pillars

We consider potential losses before gains. We think about multiple scenarios that could affect us. We ask how much we might lose before we ask how much we might make.

We focus on absolute returns, not relative returns. Our goal is to lose less than the market. We don’t manage to a benchmark.

We do not focus on the macroeconomic environment. We focus on truly great businesses we can invest in at a fair price.

Our Beliefs

We believe your lifetime investment results will be mostly governed by two variables: behavior and asset allocation.

We consider the three quotes below by two very famous investors daily in our thoughts, research and work.

“To buy when others are despondently selling and to sell when others are avidly buying, requires the greatest
fortitude and pays the greatest reward.”
John Templeton

“Be fearful when others are greedy and greedy when others are fearful.”
Warren Buffett

“Price is what you pay, value is what you get.”
Warren Buffett

Guiding Principles

  • A share of stock represents a share in the ownership of a business.
  • A stock exchange is nothing more than an auction place that provides a convenient means for exchanging your ownership in a business for cash and vice-versa.
  • Our investment approach would be akin to applying a private equity mindset to investing in public markets.
  • We limit our search for qualifying investments to good businesses. They have identifiable, sustainable competitive advantages.
  • Risks to us is permanently losing capital over a five-year time horizon. Market volatility is not risk to us.
  • Our primary return goal is to compound capital at real rates of return (4-5%) in excess of inflation over our five-year time horizon.
  • Compounding capital at 7% doubles your assets in 10 years.

Disclosures

1) Past performance is no guarantee of future results and future performance may be higher or lower than the performance shown. The performance results for each equity sleeve are calculated for us by Orion Services and does not reflect investment management fees, custody and other costs or taxes. All of which would be incurred by an investor in any account managed by Live Oak Private Wealth.

2) **The performance attribution charts represent a simple point-to-point price percentage change for the five best and five worst portfolio positions for the second quarter ending June 30, 2020 Each equity sleeve does not and is not intended to indicate past or future performance for any account or investment strategy managed by Live Oak Private Wealth. Additionally, there is no guarantee that all portfolios will own any or all of the companies mentioned.

3) There can be no assurance that our portfolio management or any account managed by our investment managers will achieve a targeted rate of return or volatility or any other specified parameters. There is no guarantee against loss resulting from an investment.

4) Investment objectives, returns, and volatility are used for measurements and/or comparison purposes only and are only a guideline for prospective investors to evaluate our investment strategy and the accompanying risk/reward ratios.

5) Comparison to any index is for illustrative purposes only. Certain information, including index and benchmark information, has been provided by third-party sources, and although believed to be reliable, has not been independently verified and its accuracy cannot be guaranteed.

6) The information contained here is not complete, may change, and is subject to, and is qualified in its entirety by, the more complete disclosures, risk factors, and other important information contained in Part 2A or 2B of Form ADV. This presentation is for informational purposes only and does not constitute an offer to sell or as a solicitation.

7) Live Oak Private Wealth is a subsidiary of Live Oak Bank. Investment advisory services are offered through LOPW, LLC, an Independent Registered Investment Advisor. Registration does not imply a certain level of skill or training.

8) Opinion and thoughts expressed are those of Bill Coleman and Frank Jolley and not Live Oak Bank.

9) Not all portfolios will necessarily own all companies mentioned, due to factors such as legacy positions, capital gain constraints, sector concentration, time, and other considerations.

Live Oak Private Wealth is pleased to announced the acquisition of Rocky Mount-based Jolley Asset Management.

Live Oak Private Wealth, a company dedicated to providing high-net-worth individuals and families with the wealth and investment management strategies they need to pursue their financial goals, has launched trust and estate planning services for its clients.