
By: Live Oak Private Wealth
“The key to investing is not assessing how much an industry is going to affect society, or how much it will grow, but rather determining the competitive advantage of any given company and, above all, the durability of that advantage. The products or services that have wide, sustainable moats around them are the ones that deliver rewards to investors.”
– Warren Buffett
Market Statistics as of 09/30/26
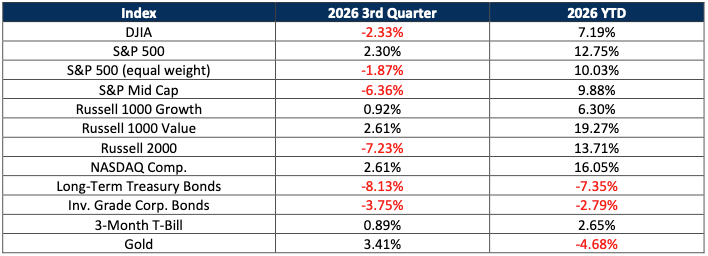
The third quarter of 2026 produced unusually wide performance gaps among asset classes and market indices. The table above captures some of this divergence, but the differences were even more pronounced over the final month or two of the quarter. For the quarter just ended, the S&P 500 generated a 2.30% total return, while the equal-weight S&P 500 Index declined 1.87%, as market leadership shifted back toward mega-cap technology stocks. As we’ve noted in prior letters, the S&P 500 is a market capitalization weighted index, giving the largest companies outsized influence, while the equal-weight index treats every constituent the same. The equal-weight S&P 500 (RSP) fell for seven consecutive weeks after peaking on August 19th, down nearly 7% through quarter-end, its longest losing streak since the 2022 bear market. Meanwhile, the market- cap-weighted S&P 500 finished the quarter just 2.1% below its all-time high of 7,816.90. The gap between those two numbers tells you what the headline index alone won’t; underneath the surface, breadth has deteriorated sharply. Nearly 60% of S&P 500 stocks were trading below their 200-day moving average at quarter end, among the weakest breadth readings in more than a year.
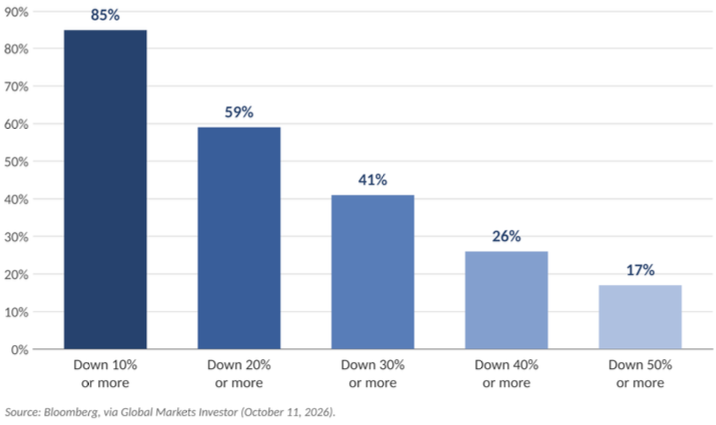
Share of S&P 500 Constituents Below Their All-Time High
Within the S&P 500, energy (+16.48%) was the leading sector, as the war in Iran continued to disrupt oil production and shipping. Information technology (+7.06%) and health care (+6.03%) followed, with communication services (+3.48%) rounding out the sectors with positive returns. On the downside, utilities (-13.03%) were hit hardest as the bond market selloff pushed yields higher and weighed on interest-rate- sensitive stocks. Industrials (-9.91%) and real estate (-6.32%) also declined sharply. Consumer discretionary (-5.24%), materials (-3.19%), consumer staples (-2.43%) and financials (-0.48%) all finished the quarter lower as well. Information technology (+4.42%) and communication services (+4.26%) were the only two sectors to gain in September, historically the weakest month of the year for stocks, and this year was no exception.
“Indexes were originally designed to measure markets, not influence them. As indexing evolved from measurement to investment, however, the act of replication began to influence the market itself.”
– Rob Arnott—Research Affiliates
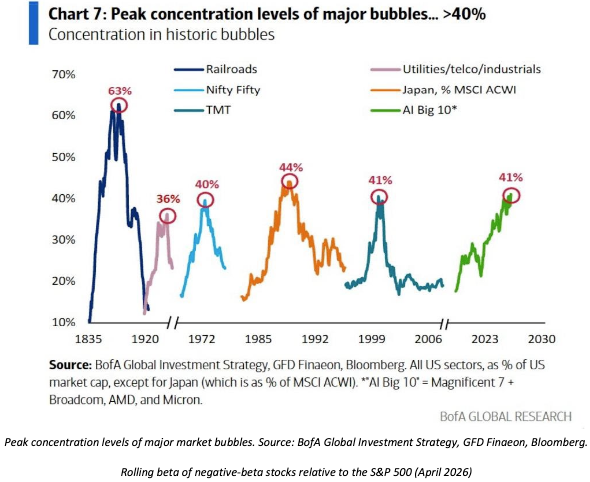
The AI boom’s influence on the S&P 500 is hard to overstate. By various Wall Street estimates, AI infrastructure and AI-related companies now account for somewhere between 30% and 45% of the index’s total market capitalization, depending on how broadly “AI-related” is defined, with most estimates clustering around 40%. Additionally, a handful of chipmakers currently represent more than a quarter of the MSCI Emerging Markets Index. AI-related companies have also become the largest single segment of investment- grade bond issuance this year, and by some estimates now account for roughly 80% or more of venture capital funding year to date, up from well under 40% at the peak of the dot-com bubble in 1999. However, you slice the data; AI has become the market, not just a part of it. The chart on the following page shows how this concentration compares to prior speculative peaks going back nearly 200 years.
We’d also like to briefly address the fixed income market, which has weighed on both the economy and stocks this year. Bond yields have risen sharply over the past six months as inflation remains a persistent problem, and higher oil prices from the war, along with rising commodity costs, have pressured many companies’ margins and earnings. It wasn’t long ago that the Federal Reserve held rates at zero trying to generate 2% inflation. The 10-year U.S. Treasury yield bottomed out around 0.50% in 2020; it closed this quarter at 5.30%. That period may go down as one of the most unusual, and in hindsight poorly conceived, chapters in monetary policy history, and it feels as though we’re now paying the price for it.
Long-term U.S. Treasuries have suffered their worst 10-year rolling return in at least 100 years, falling below the prior lows set in December 1959 and September 1981. We believe the rise in yields may be due for a pause; late in the quarter, the 30-year Treasury rose from 5.25% to 5.69% in just seven trading days. That kind of sharp move, combined with how washed-out sentiment has become, makes us think a snap-back lower in yields wouldn’t be a surprise. Only time will tell.
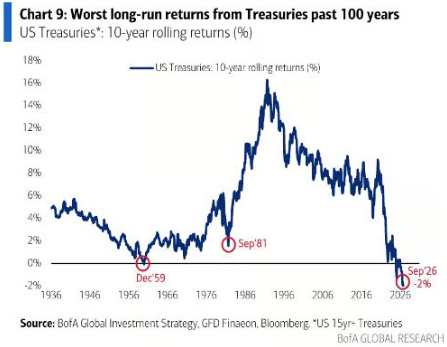
Worst long-run returns from Treasuries, past 100 years.
Source: BofA Global Investment Strategy, GFD Finaeon, Bloomberg. (September 2026)
One point worth mentioning; we remain very conservative in our bond strategy, typically buying short-term investment grade bonds with minimal credit or duration risk, so this volatility has had little effect on our client portfolio bond holdings. It’s also worth noting that the S&P 500 dividend yield has fallen to the lowest level in its history, at 1.06%. Not long ago we wrote about TINA — “there is no alternative” — when bond yields were effectively zero. Today, bonds once again offer investors a real alternative for their investment capital.
As our partner Bill Collier noted above, broad markets continue to post positive returns despite rising bond yields and a tenuous geopolitical backdrop. The analogy that comes to my mind is a duck on a pond. Above the water, a duck appears graceful; below the surface, it paddles furiously to keep moving. There is encouraging news: second-quarter GDP growth was revised to 2.2%, consumer spending is rising at a 3.8% annual rate, and unemployment stands at 4.2%. Beneath the surface, however, wars continue on multiple fronts, gas and diesel prices are reaching new highs, mortgage rates exceed 7%, and political uncertainty remains. Meanwhile Mr. Market continues to climb the proverbial wall of worry.
In closing, we remain humbled by and grateful for your trust in us to navigate today’s markets and manage your investments. As always, please reach out with any questions or concerns.
With warmest regards,
Bill Collier
Managing Director
Connor C Keller
Managing Director
DISCLOSURES:
This document is for informational purposes only and does not constitute financial advice. Live Oak Private Wealth (“LOPW”) has prepared this document for the exclusive use by the client or third party for which it was prepared. The information herein was derived from sources considered to be reliable, but the accuracy and completeness cannot be guaranteed. The information contained here is not complete, may change, and is subject to, and is qualified in its entirety by, the more complete disclosures, risk factors, and other important information contained in Part 2A or 2B of Form ADV. Past performance is not indicative of future results.
Live Oak Private Wealth is a subsidiary of Live Oak Bank. Investment advisory services are offered through LOPW, LLC, an Independent Registered Investment Advisor. Registration does not imply a certain level of skill or training. More information about Live Oak Private Wealth, including our advisory services, fees, and objectives, can be found in Part 2A or 2B of our Form ADV, which is available upon request.
This should not be construed as tax advice. You should always consult with your tax professional with regard to specific tax questions and obligations.